Last week we learned a little about the history of Processing, as well as what the coordinate system is like in Processing (and many other graphics applications as well). Today I’d like to discuss an idea which I find very helpful in making movies — linear interpolation. We’ll only have time for one simple example today, but we’ll go through that example very thoroughly.
So here’s the movie we’ll explore today. Not glamorous, but it’s a start.
You’ll notice what’s happening — the dot slowly turns from magenta to black, while the background does the opposite. Let’s look at the dot first. In Processing, RGB values go from 0 to 255. Magenta is (255, 0, 255) in RGB, and black is (0, 0, 0). We want the dot to go smoothly from magenta to black.
The way I like to do this is to introduce a parameter p. I think of p = 0 as my starting point, and p = 1 as my ending point. In this example, p = 0 corresponds to magenta, and p = 1 corresponds to black. As p varies from 0 to 1, we want the dot to go from magenta go black.
This is where linear interpolation comes in. For any start and end values, the expression
(1 – p) * start + p * end
will vary continuously from the start value to the end value as p goes from 0 to 1. It should be clear that when p = 0, you get the start value, and when p = 1, you get the end value. Any value of p in between 0 and 1 will be in between the start and end values — closer to the start value when p is near 0, and closer to the end value when p is near 1.
Because this expression is linear in p — no quadratic terms, no square roots, no sines or cosines — we say that this expression gives a linear interpolation between the start and end values.
Let’s see how this works in Processing. Here’s a screen shot of the code that produced the video shown above.
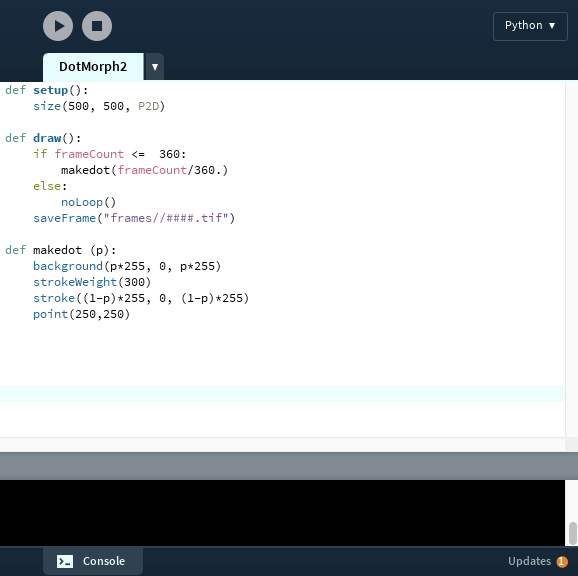
The basic functions for making a simple movie are setup and draw. The setup function is executed once before the movie starts. Then the draw function is called repeatedly — each time the draw function is called, a new frame of the movie is created.
In a typical program, if you wanted to repeat something over and over, you’d need to make a loop. But in Processing — since its purpose is to create frames for movies — this is built in to how the application works. No need to do it yourself.
So in Processing, the variable frameCount automatically keeps track of which frame you’re creating. And it is automatically incremented each time the draw function executes. You’ll find that this is a very nice feature! This way, you don’t have to keep track of frames yourself.
Note the size declaration in the setup function. Last week, I mentioned that you’ve got to set the size of your coordinate system when you start your movie. The “P2D” means you’re creating a two-dimensional image. You can make 3D objects in processing, but we won’t look at that today.
Typical applications which make movies (like PhotoShop, or the Movie Maker found in Processing’s “Tools” menu) use about 30 frames per second. So 360 frames (as above) will be a 12-second movie. Enough to see the dot and background change colors.
The if/else clause determines the frames produced. Note that when frameCount gets larger than 360, you skip to the “else” clause, which is “noLoop()”. This essentially stops Processing from creating new frames. The saveFrame command saves the individual frames to whatever directory you specify; if you forget the else clause, Processing will just keep generating more and more .tiff files and clutter up your directory.
So the if/else clause basically tells Processing this: make 360 frames, one at a time, and save then in a directory called “frames.” Once all 360 frames are made, it’s time to stop.
The makedot function is what actually creates the frame. Now we’re getting to the linear interpolation! The frameCount/360. is what creates the value of p. When frameCount is 1, the value of p is 1/360 (close enough to 0 for the purposes of our movie), and when frameCount is 360, the value of p is 1. As the value of frameCount increases, p increases from about 0 to 1.
It’s important to use a decimal point after the number 360. If you don’t, Python will use integer division, and you’ll get 0 every time until frameCount reaches 360, and only then will you get 1. (I learned this one the hard way…took a few minutes to figure out what went wrong.)
So let’s go through the makedot function line by line. First, we set the background color. Note that when p is 0, the color is (0, 0, 0) — black. As p moves closer to 1, the black turns to magenta. It is also important to note that when you call the background function, the entire screen is set to the color you specify. Processing will write over anything else that was previously displayed. So be careful where you put this command!
Next, the width of lines/points drawn is set with strokeWeight. Remember that the units are pixels — so the width of the dot is 300 pixels on a screen 500 pixels wide. Pretty big dot.
The stroke command sets the color of lines/points on the screen. Notice the (1 – p) here — we want to begin with magenta (when p = 0), and end with black (when p = 1). So we go the “opposite” direction from the background.
Maybe you noticed that at one point, the dot looked like it “disappeared.” Not really — note that when p = 1/2, then 1 – p = 1/2 as well! At this time, the dot and background are exactly the same color. That’s why it looked like the dot vanished.
And last but not least — the dot. Remembering the coordinate system, the dot is centered on the screen at (250, 250).
That’s it. Not a long program, but all the essentials are there. Now you’ve got a basic idea of how simple movies can me made. The next post will build on this week’s and look at some more examples of linear interpolation. Stay tuned!
 Or we might alternatively say

 is a result of the fact that the positive y direction is pointing down.