ColorSlide Puzzles

Part of the fun of writing a math blog is designing new puzzles.  I wanted to come up with a puzzle which incorporated color and logic, so here’s the result!

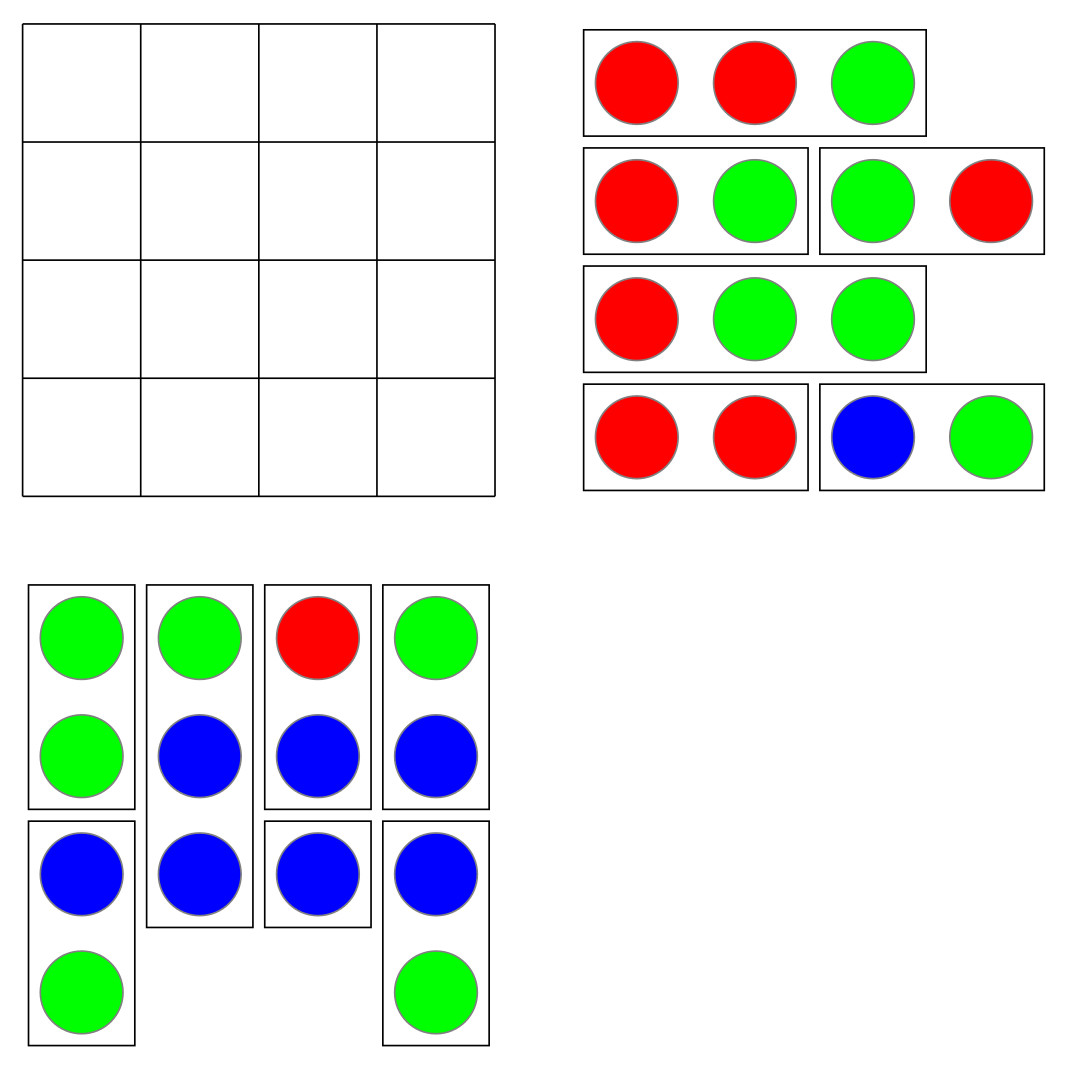
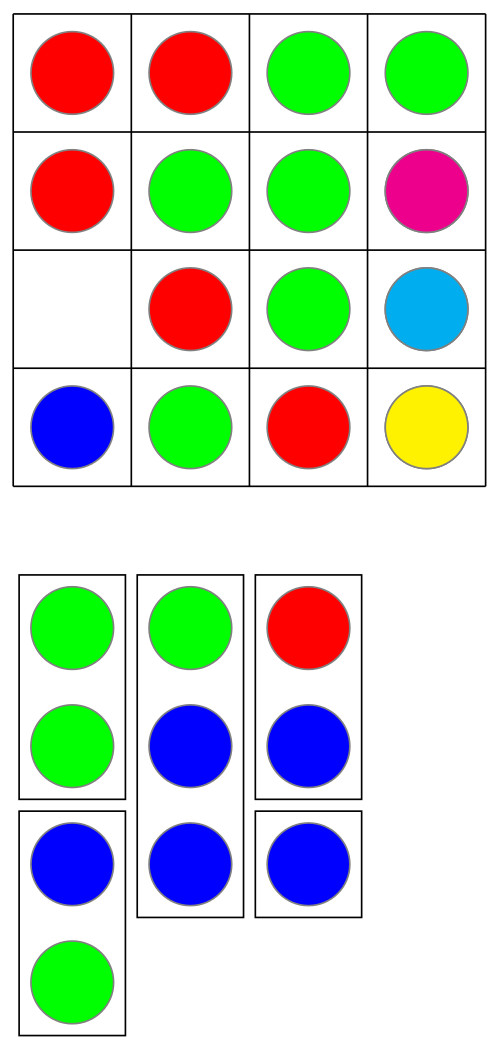
In the grid below, slide the tiles either horizontally or vertically onto the grid so that each row and column contains exactly one each of green, cyan, magenta, and yellow dots. When two dots share the same square, they are combined, so that if a green and a red dot occupy the same square, the dot is yellow, while if a blue and a green dot occupy the same square, a cyan dot is produced. In other words, overlapping the tiles is like adding their RGB values.  (If you aren’t familiar with RGB values, you can experiment in the “Continue reading” section by searching for Day002 in my blog.)  Horizontal tiles may only overlap vertical tiles (and not other horizontal tiles), and vertical tiles may only overlap horizontal tiles.

Dots of the same color may never overlap — although this condition follows from the puzzle setup. Note that green, cyan, and yellow all require a green dot, so with four rows/columns, at least 12 green dots are necessary. Since there are exactly 12 green dots, no two green dots may overlap. Similar arguments show that no two red dots or two blue dots may overlap, either.

Day010CS1

In the first part of the post, we’ll solve this puzzle so you see what’s involved.  We’ll look at the design later.

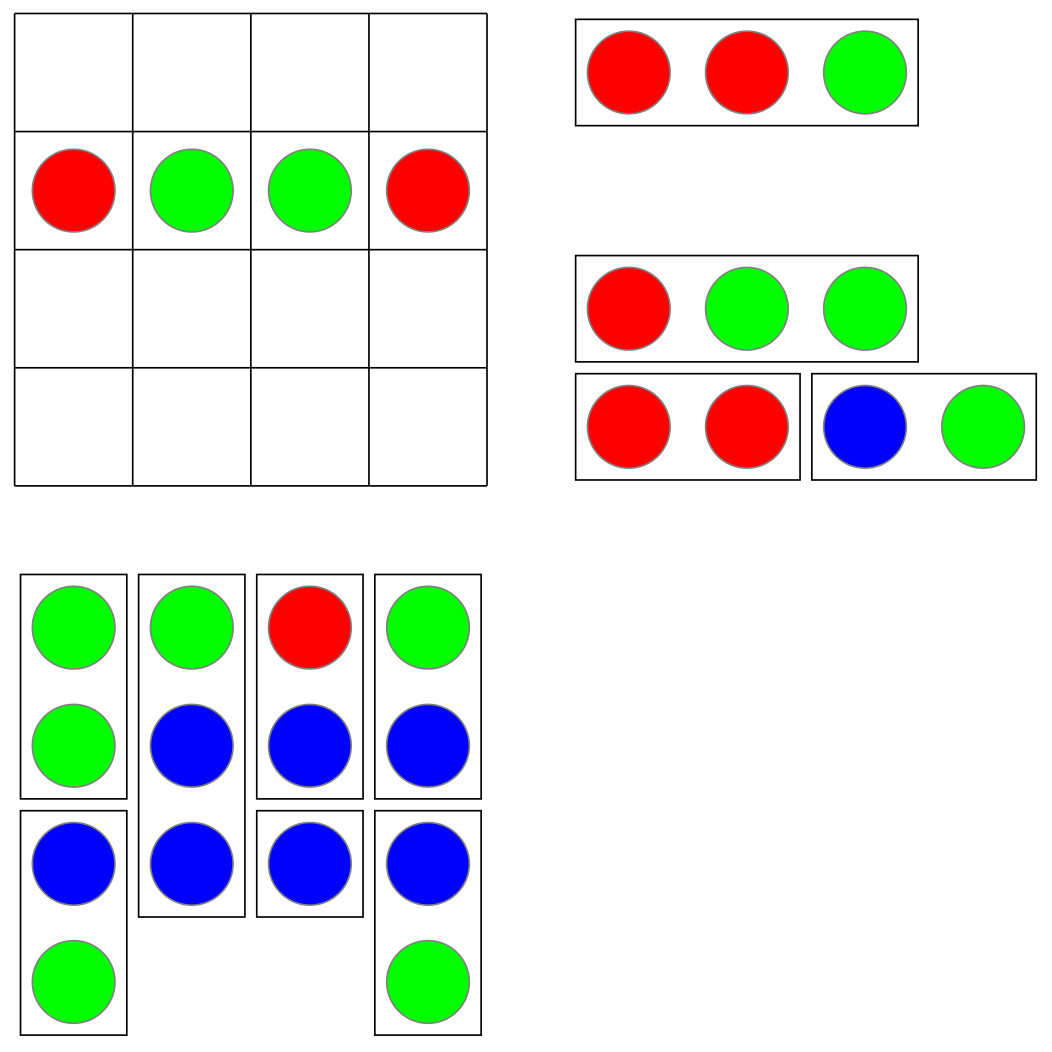
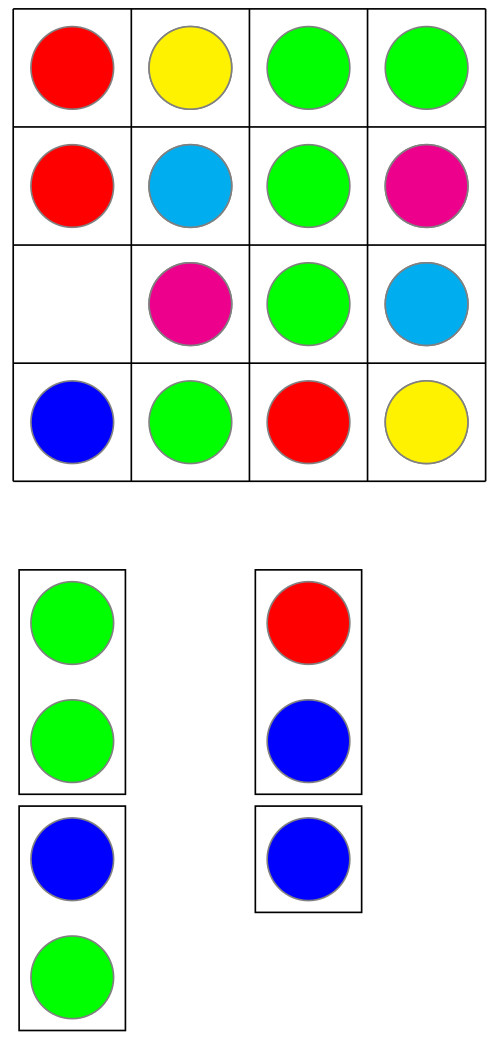
Let’s start by looking at Column 1. Each row column needs three green dots, two red dots, and two blue dots — this follows from the fact the the RGB values of the four colors in the completed puzzle are (0,1,0), (0,1,1), (1,0,1), and (1,1,0). Since the vertical tiles in Column 1 already include three green dots, we know how to place the tiles in Row 2, since we need to avoid a fourth green dot in the first column. This results in

Day010CS2

Now see that however the tiles are placed in Column 1, the dot at (2,1) — Row 2 and Column 1 — must be yellow. So (2,4) can’t be yellow, and therefore we know how to place the tiles in Column 4.

Day010CS3

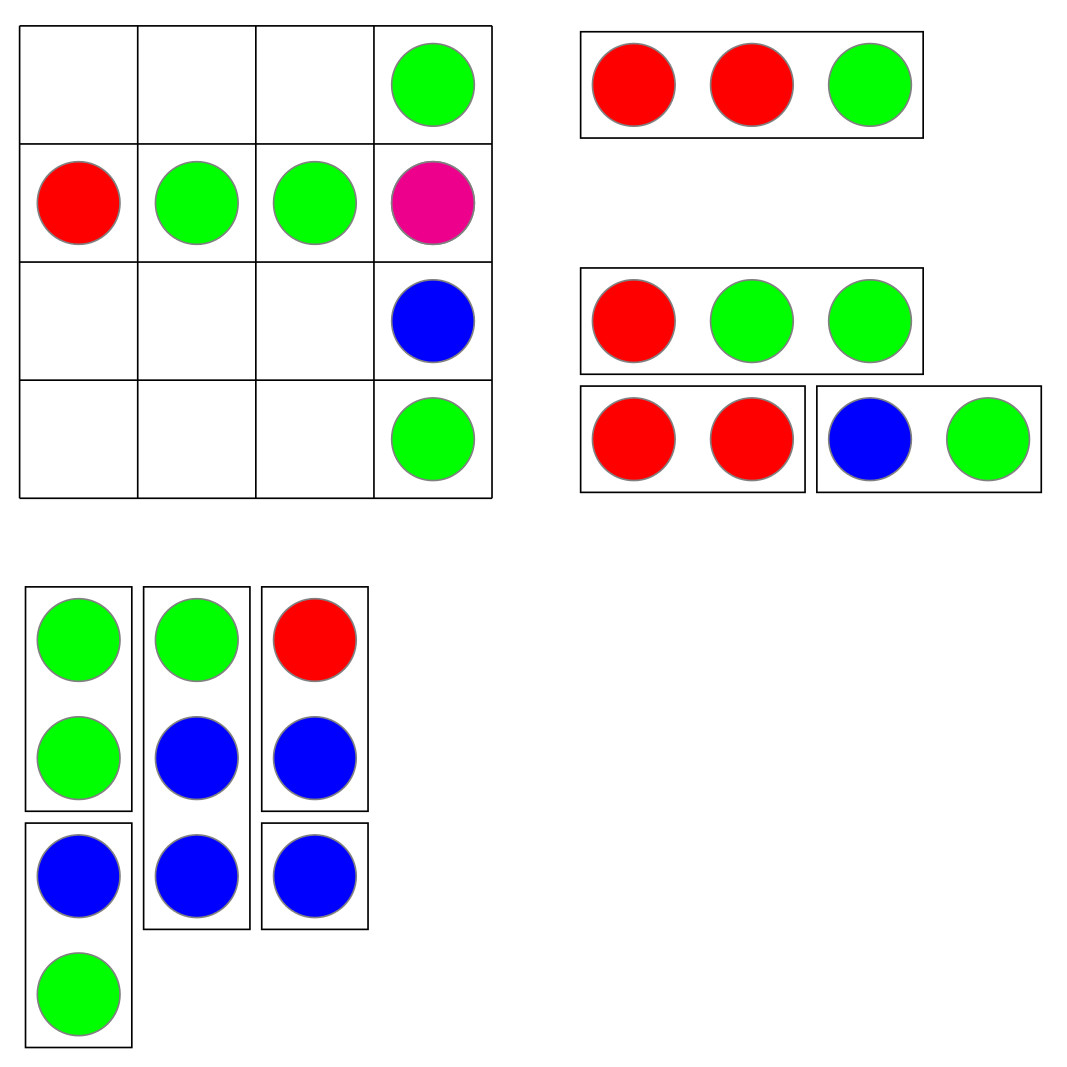
Note how the red and blue dots overlap to create magenta.  Since there are no blue dots in the completed puzzle, we must place the tile in Row 3 so that the blue dot is covered by a green one (making a cyan dot).

Day010CS4

Since green dots cannot overlap, we know how to place the tiles in Rows 1 and 4.  Note the red and green dots overlapping in (4,4) to create yellow.

Day010CS5

Since green dots cannot overlap, we know how to place the tile in Column 2.  See how the overlapping dots create yellow, cyan, and magenta dots.

Day010CS6

Now in Column 1, there can only one be yellow dot. So we know how to place the tiles in Column 1, and it is easy to slide the remaining tiles from Column 3.

Day010CS7

That wasn’t so bad! Just a little knowledge of color theory and a bit of logic is all you need.

These puzzles are fun to create.  However, there are a few issues to be aware of.  The first arises since you want to avoid too many single dots — I used just one in the first puzzle, and I think that’s enough.  It’s actually rather easy to create a grid with one of each color in each row and column — there are called Latin squares.  The hard part is then creating an appropriate set of tiles.  The difficulty lies with the fact that some squares are covered by just one tile, others by two.

In the following small grid, the numbers represent how many dots are needed to create a color in a certain location.

Day010CS8

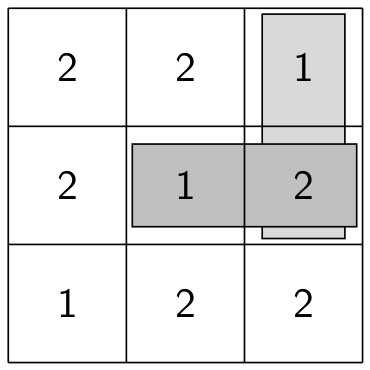
Suppose we wanted a vertical tile to cover a 1 and a 2 in column 3.  Since (2,3) is covered by two tiles and vertical tiles cannot overlap, this means we must use a horizontal tile here.  But then the only way to cover location (1,2) is with a horizontal tile and a vertical tile of height 1 (since the 1’s are already covered).  But this is exactly what we want to avoid!  Once I realized was happening, I first designed a grid with just 1’s and 2’s and a corresponding tile set, then added the colors later.  In other words, I broke a harder design problem into two easier ones.

The other issue which arose was the question of uniqueness.  It’s desirable to have a unique solution to puzzles like this — when you design a puzzle, you clearly have one solution, but can you be sure that there aren’t any others?  This is not an insurmountable task, but for the larger puzzle below, it was more involved than I thought it would be.

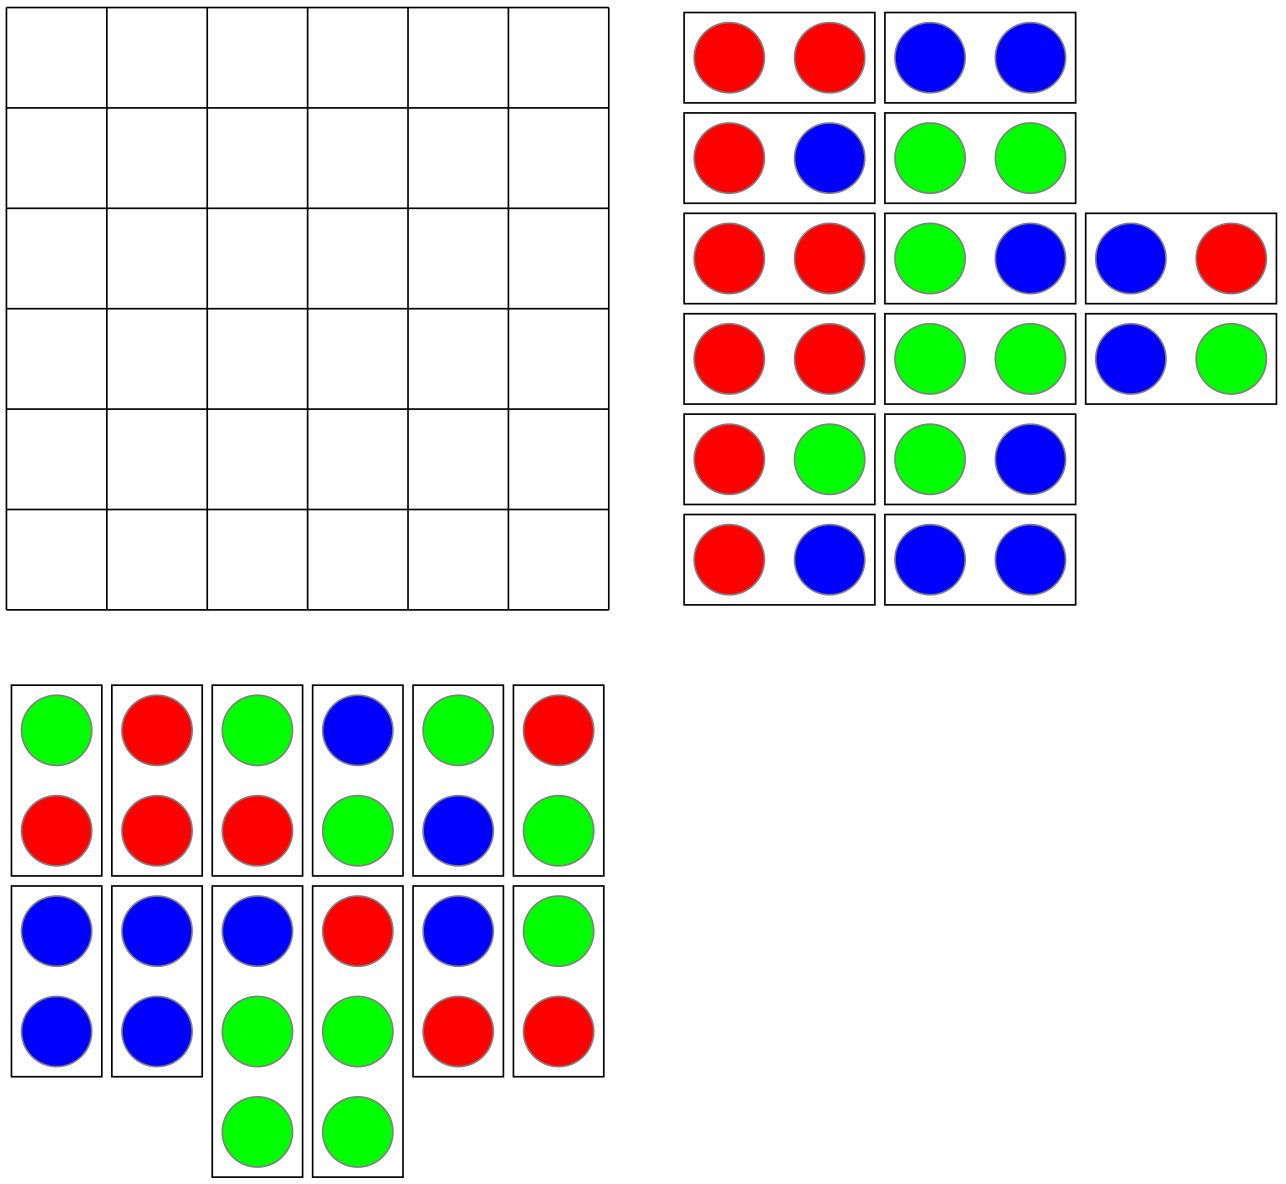
So I leave you with a 6 x 6 puzzle to solve.  Slide the tiles so that there is a red, green, blue, yellow, magenta, and cyan dot in each row and column.  As mentioned above, the solution is unique.  Feel free to post your own puzzles if you create them!

Day010CS9

Creating Fractals III: Making Your Own

Last week, we laid down some of the mathematical foundation needed to generate fractal images.  In this third and final post about creating fractals, we’ll discuss in some detail Python code you can adapt to making your own designs.  Follow along in this Sage notebook.

In order to produce fractal images iteratively, we need a function which returns the highest power of 2 within a positive integer (as discussed last week).  It is not difficult to write a recursive routine to do this, as is seen in the notebook.  This is really all we need to get started.  The rest involves creating the graphics.  I usually use PostScript for my images, like the one below discovered by Matthieu Pluntz.  There isn’t time to go into that level of detail here, though.

Day009Koch090-150

As far as the graphics are concerned, it would be nice to have an easily described color palette.  You might look here to find a wide range of predefined colors, which are available once we execute the “import mathplotlib” command (see Line 20).  These names are used in the “colors” variable.  Since each motif has four segments, I’ll color each one differently (though you may choose a different color scheme if you want to).

The loop is fairly straightforward.  On each iteration, first find the correct angle to turn using the highestpowerof2 function.  Then the segment to add on to the end of the path is

({\rm len}\cdot\cos(\theta), {\rm len}\cdot\sin(\theta)),

which represents converting from polar to rectangular coordinates.  This is standard fare in a typical high school precalculus course.  Note the color of the segment is determined by i % 4, since 0 is the index of the first element of any list in Python.

All there is left to do is output to the screen.  We’re done!  You can try it yourself.  But note that the way I defined the function, you have to make the second argument negative (compare the image in the notebook with last week’s post).  Be patient:  some of these images may take a few moments to generate.  It would definitely help the speed issue if you downloaded Sage on your own computer.

To create the image shown above, you need to use angles of 90 and -210 (I took the liberty of rotating mine 15 degrees to make it look more symmetrical).  To create the image below, angles of 90 and -250 are used.  However, 26,624 steps are needed to create the entire image!  It is not practical to create an image this complex in the online Sage environment.

Day009koch090-110

How do you know what angles to use?  This is still an open question — there is no complete answer that I am aware of.  After my first post on October 4, Matthieu Pluntz commented that he found a way to create an infinite variety of fractal images which “close up.”  I asked him how he discovered these, and he responded that he used a recursive algorithm.  It would take an entire post just to discuss the mathematics of this in detail — so for now, we’ll limit our discussion to how to use this algorithm.  I’ve encoded it in the function “checkangles.”

To use this function, see the examples in the Sage notebook.  Be careful to enter angles as negative when appropriate!  Also, you need to enter a maximum depth to search, since perhaps the angles do not result in an image which “closes up,” such as with 11 and -169.  But here’s the difficult part mathematically — just because our algorithm doesn’t find where 11 and -169 closes up does not mean that the fractal doesn’t close.  And further, just because our algorithm produced a positive result does not mean the algorithm must close.  Sure, we’ve found something that produces many results with interesting images — which suggests we’re on the right track.  But corroboration by a computer program is not a proof.

At the end of the notebook, I wrote a simple loop illustrating how you can look for many possibilities to try at once.  The general rule of thumb is that the more levels required in the algorithm to produce a pair of angles (which is output to the screen), the more segments needed to draw it.  I just looked for an example which only required 5 levels, and it was fairly easy to produce.

So where do we go from here?  Personally, I’ve found this investigation fascinating — and all beginning from a question by a student who is interested in learning more about fractals.  I’ve tried to give you an idea of how mathematics is done in the “real world” — there is a lot of exploration involved.  Proofs will come later, but it is helpful to look at lots of examples first to figure out what to prove.  When I find out something significant, I’ll post about it.

And I will admit a recent encounter with the bane of a programmer’s existence — the dreaded sign error.  Yes, I had a minus sign where I should have had a plus sign.  This resulted in my looking at lots of images which did not close up (instead of closing up, as originally intended).  Some wonderful images resulted, though, like the one below with angles of 11 and -169.  Note that since the figure does not close up (as far as I know), I needed to stop the iteration when I found a sufficiently pleasing result.

Day009koch011-191

If I hadn’t made this mistake, I might have never looked at this pair of angles, and never created this image.  So in my mind, this wasn’t really a “mistake,” but rather a temporary diversion along an equally interesting path.

I’ve been posting images regularly to my Twitter feed, @cre8math.  I haven’t even touched on the aesthetic qualities of these images — but suffice it to say that it has been a wonderful challenge to create interesting textures and color effects for a particular pair of angles.  Frankly, I am still amazed that such a simple algorithm — changing the two angle parameters used to create the Koch snowflake — produces such a wide range of intriguing mathematical and artistic objects.  You can be sure that I’m not finished exploring this amazing fractal world quite yet….

Creating Fractals II: Recursion vs. Iteration

There was such a positive response to last week’s post, I thought I’d write more about creating fractal images.  In the spirit of this blog, what follows is a mathematical “stream of consciousness” — that is, my thoughts as they occurred to me and I pursued them.  Or at least a close approximation — thoughts tend to jump very nonlinearly, and I do want the reader to be able to follow along….

Let’s begin at the beginning, with one of my first experiments.  Here, the counterclockwise turns are 80 degrees, and the clockwise turns are 140 degrees.

Day008koch+80-140One observation I had made in watching PostScript generate such images was that there was “overlap”:  the recursive algorithm kept going even if the image was completely generated.  Now the number of segments drawn by the recursive algorithm is a power of 4, since each segment is replaced by 4 others in the recursive process.  So if the number of segments needed to complete a figure is not a power of 4, the image generation has to be stopped in the middle of a recursive call.

This reminded me of something I had investigated years ago — the Tower of Hanoi problem.  This is a well-known example of a problem which can be solved recursively, but there is also an iterative solution.  So I was confident there had to be an iterative way to generate these fractal images as well.

I needed to know — at any step along the iteration — whether to turn counterclockwise or clockwise.  If I could figure this out, the rest would be easy.  So I wrote a snippet of code which implemented the recursive routine, and output a 0 if there was a counterclockwise turn, and a 1 if there was a clockwise turn.  For 2 levels of recursion, this sequence is

0, 1, 0, 0, 0, 1, 0, 1, 0, 1, 0, 0, 0, 1, 0.

The ones occur in positions 2, 6, 8, 10, and 14.

I actually looked at 1024 steps in the iteration, and noticed that the ones occur in exactly those positions whose largest power of 2 is odd.  Each of 2, 6, 10, and 14 has one power of 2, and 8 has three.

You might be wondering, “How did you notice that?”  Well, the iterative solution of the Tower of Hanoi does involve looking at the powers of 2 within numbers, so past experience suggested looking along those lines.  This is a nice example of how learning neat math can enlarge your mathematical “toolbox.”  You never know when something might come in handy….

There was other interesting behavior as well — but it’s simpler if you just watch the video to see what’s happening.

First, you probably noticed that each of the 18 star arms takes 32 steps to create.  And that some of the star arms — eight of them — were traversed twice.  This means that 18 + 8 = 26 arms were drawn before the figure was complete, for a total of 832 steps.  Note that the recursive algorithm would need 1024 steps to make sure that all 832 steps were traversed — but that means an overlap of 192 steps.

Now let’s see why some of the arms were traversed twice.  The 32nd step of the first arm is produced after 31 turns, and so the 32nd turn dictates what happens here.  Now the highest power of 2 in 32 is 5, which is odd – so a clockwise turn of 140 degrees is made.  You can see by looking at the first 33 steps that this is exactly what happens.  The 32nd step takes you back to the center, and then a 140 degree clockwise turn is made.

Day008Fractal33Now after the next arm is drawn, the turn is determined by the 64th angle.  But 6 is the highest power of two here, and so an 80 degree counterclockwise turn is made — but this takes you over the same arm again!

Day008Fractal65Note that we can’t keep traversing the same arm over and over.  If we add 32 to a number whose highest power of 2 is 6:

2^6m+2^5=2^5(2m+1),

we get a number whose highest power of 2 is 5 again (since 2m + 1 must be odd).  Since this power is odd, a clockwise turn will be made.

So when do we repeat an arm?  This will happen when we have a counterclockwise turn of 80 degrees, which will happen when the highest power of 2 is even (since an odd power takes you clockwise) — when looking at every 32nd turn, that is.  So, we need to look at turns

32, 64, 96, 128, 160, 192, 224, etc.

But observe that this is just

32 x (1, 2, 3, 4, 5, 6, 7, etc.).

Since 32 is an odd power of two, the even powers of two must occur when there is an odd power of 2 in 1, 2, 3, 4, 5, 6, 7, etc.  In other words, in positions 2, 6, 8, 10, 14, etc.

To summarize this behavior, we can state the following simple rule:  arms move seven points counterclockwise around the circle, except in the case of the 2nd, 6th, 8th, 10th, 14th, etc., arms, which repeat before moving seven points around.  Might be worth taking a minute to watch the video again….

We can use this rule to recreate the order in which the star arms are traversed.  Start with 1.  The next arm is 1 + 7 = 8.  But 8 is the 2nd arm, so it is repeated — and so 8 is also the third arm.  The fourth arm is 8 + 7 = 15, and the fifth is seven positions past 15, which is 4.  Mathematically, we say 15 + 7 = 4 modulo 18, meaning we add 15 and 7, and then take the remainder upon dividing by 18.  This is know as modular arithmetic, and is one of the first things you learn when studying a branch of mathematics called number theory.

The sixth arm is 4 + 7 = 11, which is repeated as the seventh arm.  You can go on from here….

There are still some questions which remain.  Why 32 steps to complete an arm?  Why skip every seventh arm?  Why are the arms 20 degrees apart?  These questions remain to be investigated more thoroughly.  But I can’t stress what we’re doing strongly enough — using the computer to make observations which can be stated mathematically very precisely, and then looking at a well-defined algorithm to (hopefully!) prove that our observations are accurate.  More and more — with the advent of technology — mathematics is becoming an experimental science.

I’ll leave you with one more video, which shows PostScript creating a fractal image.  But laying a mathematical foundation was important — so next week, we can look at how you can make your own fractals in Python using an iterative procedure.  This way, you can explore this fascinating world all on your own….

There are 10 levels of recursion here, and so 1,048,576 segments to draw.  To see the final image, visit my Twitter feed for October 9.  Enjoy!

Creating Fractals

Recently, I’ve been working with a psychology student interested in how our brains perceive fractal images in nature (trees, clouds, landscapes, etc.). I dug up some old PostScript programs which reproduced images from The Algorithmic Beauty of Plants, which describes L-systems and how they are used to model images of plants. (Don’t worry if you don’t have the book or aren’t familiar with L-systems — I’ll tell you everything you need to know.)

To make matters concrete, I changed a few parameters in my program to produce part of a Koch snowflake.

Day007koch1The classical way of creating a Koch snowflake is to begin with the four-segment path at the top, and then replace each of the four segments with a smaller copy of this path. Now replace each of the segments with an even smaller copy, and recurse until the copies are so small, no new detail is added.

Algorithmically, we might represent this as

F  +60  F  -120  F  +60  F,

where “F” represents moving forward, and the numbers represent how much we turn left or right (with the usual convention that positive angles move counter-clockwise). If you start off moving to the right from the red dot, you should be able to follow these instructions and see how the initial iteration is produced.

The recursion comes in as follows: now replace each occurrence of F with a copy of these instructions, yielding

F  +60  F  -120  F  +60  F  +60

F  +60  F  -120  F  +60  F  -120

F  +60  F  -120  F  +60  F  +60

F  +60  F  -120  F  +60  F

If you look carefully, you’ll see four copies of the initial algorithm separated by turning instructions. If F now represents moving forward by 1/3 of the original segment length, when you execute these instructions, you’ll get the second image from the top. Try it! Recursing again gives the third image, and one more level of recursion results in the last image.

Thomas thought this pretty interesting, and proceed to ask what would happen if we changed the angles. This wasn’t hard to do, naturally, since the program was already written. He suggested a steeper climb of about 80 degrees, so I changed the angles to +80 and -140.

Day007koch2

Surprise! You’ll easily recognize the first two iterations above, but after five iterations, the image closes up on itself and creates an elegant star-shaped pattern.

I was so intrigued by stumbling upon this symmetry, I decided to explore further over the upcoming weekend. My next experiment was to try +80 and -150.

Day007koch3The results weren’t as symmetrical, but after six levels of recursion, an interesting figure with bilateral symmetry emerged. You can see how close the end point is to the starting point — curious. The figure is oriented so that the starting points (red dots) line up, and the first step is directly to the right.

Another question Thomas posed was what would happen if the lengths of the segments weren’t all the same. This was a natural next step, and so I created an image using angles of +72 and -152 (staying relatively close to what I’d tried before), and using 1 and 0.618 for side lengths, since the pentagonal motifs suggested the golden ratio. Seven iterations produced the following remarkable image.

Day007koch4I did rotate this for aesthetic reasons (-24.7 degrees, to be precise). There is just so much to look at — and all produced by changing a few parameters in a straightforward recursive routine.

My purpose in writing about these “fractal” images this week is to illustrate the creative process in doing mathematicsThis just happened a few days ago (as I am writing this), and so the process is quite fresh in my mind — a question by a student, some explorations, further experimentation, small steps taken one at a time until something truly wonderful emerges.  The purist will note that the star-shaped images are not truly fractals, but since they’re created with an algortihm designed to produce a fractal (the Koch snowflake), I’m taking a liberty here….

This is just a beginning! Why do some parameters result in symmetry? How can you tell? When there is bilateral symmetry, what is the “tilt” angle? Where did the -24.7 come from? Each new image raises new questions — and not always easy to answer.

Two weeks ago, this algorithm was collecting digital dust in a subdirectory on my hard drive. A simple question resurrected it — and resulted in a living, breathing mathematical exploration into an intensely intriguing fractal world. This is how mathematics happens.

Continue reading Creating Fractals