On Coding XIII: Retrospective.

I published the first installment of On Coding on September 11, 2016.  It seems a bit surreal that this thread is over a year old — but all good things must come to an end.  I really enjoyed writing these posts; they helped me organize my thoughts about my own personal coding history.

But there are some loose ends I’d like to tie up.  I’ve had brief forays into other languages — too brief to devote an entire post to any one of them.  I’ve mentioned a few of them here and there, but I’d like to take the opportunity to include them all in one post.

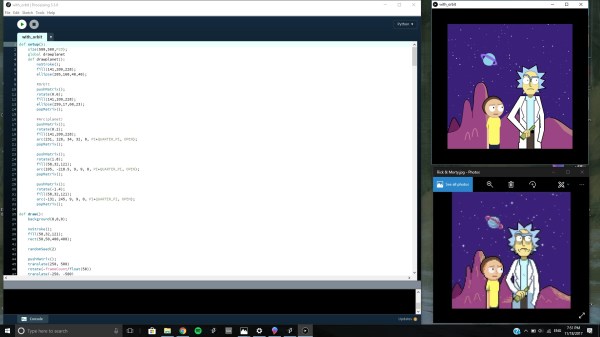
Before doing so, I should mention that Processing is my most recent programming adventure.  But I have written so much about using Processing in the context of my digital art course, I don’t feel the need to devote a separate post to it.  And I feel I might bore you, dear reader….

The first is PASCAL, which I first learned while taking an undergraduate programming class.  Other than the course, I only did a few other things with PASCAL.  I did write a routine that printed out 4 x 4 magic squares — I was really into magic squares back in college.  I also dabbled with computer graphics and geometrical inversion — I recall giving a talk where I discussed geometrical inversion, and I split the screen so on one side you saw lines tangent to a conic section, while on the other side, you saw inverse circles tangent to the inverse limaçon.

While in graduate school, I had a one-year stint filling in for a faculty member at a nearby college, and I taught a data structures course using PASCAL.  Now, I would never think of PASCAL as a go-to language for any particular purpose.  It’s still around, but not nearly as popular as it was then.

The next is LISP*, which I used while teaching at a summer program during graduate school.  This was a parallel version of LISP written for the Connection Machine, a state-of-the-art supercomputer in its day.  It had literally thousands of different processors, each very simple.  But because of the sheer number of processors, the speed of the Connection Machine merited it the designation “supercomputer.”

The language was quite similar to LISP, except that many functions had parallel versions which could be executed on each processor.  I can’t recall much of what I did on the Connection Machine, but I do remember programming Conway’s Game of Life on a 1000 x 1000 torus.  Of course I can do that on my laptop right now in Mathematica, but at the time, it was a real feat!  Remember, that was back in the day when Mandelbrot sets were calculated pixel by pixel and computers were so slow you could actually see the pixels march right on by….

Chronologically, Maple — a direct competitor of Mathematica — comes next, sort of…I used Maple around the same time as LISP*.  I seem to recall the only reason I played around with it was that I had a house-sitting job for a few summers, and there was a computer I could use which had Maple on it.

I recall finding Maple really useful, but there was a bit more syntax than with Mathematica.  I really like Mathematica‘s fundamental data type — the list, just like LISP.  But I think part of the reason I’ve stuck with Mathematica through the years is that most places I’ve been have supported it — and being free is a big advantage.  I know Maple has changed a lot since I last used it, so I don’t feel I’m able to say more about a comparison with Mathematica than what I’ve already said.

Jump ahead a few years to C++.  I can’t remember exactly when I started learning it, but I was teaching at a small liberal arts college, and a colleague who usually taught an algorithms course was going on sabbatical.  I was really the only other faculty member at the university qualified to teach it, and so there it was!  The students in the course knew C++, so I needed to learn it, too….

Well, I should say I learned enough to write code for an introductory algorithms course, which means I didn’t have to dive too deeply in.  I can’t say I used C++ for much after I taught the course, except I remember writing some routines to do financial planning.  You know, like if you have different investments at different interest rates for different numbers of years, etc., how much will you have when you retire?  (Being a mathematician, I thought it insane that I should pay someone else to do my financial planning, so I read everything I could on the topic and did it myself.)  But I haven’t used C++ since.

Last — and perhaps least — there’s Java.  I learned Java was when I was applying for a job teaching mathematics and computer science, and the language taught was Java.  I had never written a line in Java before, and there was some concern that I wasn’t qualified.

So I wrote a little interactive game based on some puzzles I created, which was really quite nice, if I must say.  The only way to show you know how to code in a language is to code, so I did it.

It was rather unpleasant, though.  What I needed to do was really just algorithmic, and the object-orientedness of Java and the need to precisely define data structures really got in the way.  I hope never to write another line of Java again.  (Incidentally — long story — I was offered the job but turned it down.  Saved me from teaching Java….)

And I think that’s about it!  If I can leave you with anything after this series, it’s GO CODE!  Learn as many different types of languages as you can.  The best way to learn is to find something you really want to do, and then go for it.

Remember, my first programming language was Fortran — using punch cards.  Running batch jobs.  Today, you’ve got laptops and the internet.  The only limit is your imagination….


Bay Area Mathematical Artists, III

Another successful meeting of the Bay Area Mathematical Artists took place yesterday at the University of San Francisco!  It was our largest group yet — seventeen participants, include three new faces.  We’re gathering momentum….

Like last time, we began with a social half hour from 3:00–3:30.  This gave people plenty of time to make their way to campus.  I didn’t have the pleasure of participating, since the campus buildings require a card swipe on the weekends; I waited by the front door to let people in.  But I did get to chat with everyone as they arrived.

We had a full agenda — four presenters took us right up to 5:00.  The first speaker was Frank A. Farris of Santa Clara University, who gave a talk entitled Fibonacci Wallpaper Spirals.

p4IrisLoRes.jpg

He took inspiration from John Edmark’s talk on spirals at Bridges 2017 in Waterloo, which I wrote about in my blog last August (click here to read more).  But Frank’s approach is rather different, since he works with functions in the complex plane.

He didn’t dive deeply into the mathematics in his talk, but he did want to let us know that he worked with students at Bowdoin College to create open-source software which will allow anyone to create amazing wallpaper patterns.  You can download the software here.

Where do the Fibonacci numbers come in?  Frank used the usual definition for the Fibonacci numbers, but used initial values which involved complex numbers instead of integers.  This allowed him to create some unusually striking images.  For more details, feel free to contact him at ffarris@scu.edu.

Next was our first student talk of the series, My Experience of Learning Math & Digital Art, given by Sepid Ebrahimi.  Sepid is a student in my Mathematics and Digital Art course; she is a computer science major and is really enjoying learning to code in Processing.
Sepid
First, Sepid mentioned wanting to incorporate elements into her work beyond simple points, circles, and rectangles.  Her first project was to recreate an image of Rick and Morty, the two main characters in the eponymous cartoon series.  She talked about moving from simple blocks to bezier curves in order to create smooth outlines.
Sepid then discussed her second project, which she is using for her Final Project in Mathematics and Digital Art.  In order to incorporate sound into her work, she learned to program in Java to take advantage of already-existing libraries.  She is creating a “live audio” program which takes sound input in real time, and based on the frequencies of the sound, changes the features of various geometrical objects in the video.  Her demo was very fascinating, and all the more remarkable since she just started learning Processing a few months ago.  For more information, you can contact Sepid at sepiiid.ebra@gmail.com.
The third talk, Conics from Polygons: the Chord Ratio Construction, was given by Scott Vorthmann.  He is spreading the word about vZome, an open-source virtual environment where you can play with Zometools.
The basis of Scott’s talk was a simple chord ratio construction, which he is working on with David Hall.  (Here is the GeoGebra worksheet if you would like to play with it.)  The essential idea is illustrated below.
chordratio
Begin with two segments, the red and green ones along the coordinate axes.  Choose a ratio r.  Now add a chord parallel to the second segment and r times as long — this gives the thick green segment at y = 1.  Connect the dots to create the third segment, the thin green segment sloping up to the right at x = 1.  Now iterate — take the second and third segments, draw a chord parallel to the second segment and r times as long (which is not shown in the figure), and connect the dots to form the fourth segment (the thin green segment sloping to the left).
Scott then proceeded to show us how this very simple construction, when iterated over and over with multiple starting segments, can produce some remarkable images.
scott
Even though this is created using a two-dimensional algorithm, it really does look three-dimensional!  Conic sections play a fundamental role in the geometry of the points generated at various iterations.  Quadric surfaces in three dimensions also come into play as the two-dimensional images look like projections of quadric surfaces on the plane.  Here is the GeoGebra worksheet which produced the graphic above.  For more information, you can contact Scott at scott@vorthmann.org.
 The final presenter was Stacy Speyer, who is currently an artist-in-residence at Planet Labs.  (Click here to read more about art at Planet Labs.)  She didn’t give a slideshow presentation, but rather brought with her several models she was working on as examples of Infinite Polyhedra Experiments with Planet’s Satellite Imagery.
Planet-1stTryInfinte4_6.jpg
One ongoing project at Planet Labs is planetary imaging.  So Stacy is taking high-resolution topographical images and using them to create nets for polyhedra.  She is particularly interested in “infinite polyhedra” (just google it!).  As you can see in the image above, six squares meet at each vertex, and the polyhedron can be extended arbitrarily far in all directions.
One interesting feature of infinite polyhedra (as you will notice above) is that since you cannot actually create the entire polyhedron, you’ve got to stop somewhere.  This means that you can actually see both sides of all the faces in this particular model.  This adds a further dimension to artistic creativity.  Feel free to contact Stacy at cubesandthings@gmail.com for more information!
We’ll have one more meeting this year.  I am excited to see that we’re making so much progress in relatively little time.  Presentations next time will include talks being prepared for the Joint Mathematics Meetings in San Diego this coming January, so stay tuned!


Beguiling Games III: Splotch!

In this installment of Beguiling Games, we’ll learn how to play Splotch!

Day119Splotch1

But first, I’ll start off by giving you the solution to the last puzzle I presented in the last installment.  The statement of the puzzle is too long to repeat, so you can refresh your memory at Beguiling Games II.

First, it is important to note that Lucas’s statement actually provides no information!   Suppose Ophelia’s card was Truthteller.  Then she would have told the truth in Round 1, passed her card to Lucas, and he would truthfully have stated that she told the truth in Round 1.

But what if Ophelia’s card was Liar?  Then her statement “I am a Truthteller” in Round 1 would in fact have been a lie.  Now she passes her card to Lucas.  He lies and says she told the truth in Round 1!  What this means is Lucas could have made his statement in Round 2 regardless of what card Ophelia passed him.

Note that the same logic applies to Mordecai’s statement.  He could have said “Lucas also told the truth in the first round” regardless of whether Lucas passed him a Truthteller or a Liar card.

Now let’s examine Nancy’s statement in some detail.  She said that there is at least one liar at the table.  Could she have lied?

Well, if the fact that the there is at least one liar at the table is false, that means everyone is a Truthteller.  But there is no way Nancy could have known this, since the only two cards she saw were hers and the card passed to her by Mordecai.

That means Nancy must have told the truth in Round 2, and Mordecai must have passed her a Truthteller card.  But in order for her to have sufficient information to say there is at least one Liar at the table, she must have been holding a Liar card in Round 1.

Now this information could be deduced by anyone at the table.  In other words, anyone would know that Nancy held a Liar card in Round 1, and Mordecai held a Truthteller card.  That leaves Lucas’s and Ophelia’s cards in Round 1.

The only person who could know both these cards would be Lucas — he knew his own card in Round 1, and he knew Ophelia’s card because she passed it to him in Round 2.  So he had enough information to declare after Nancy’s statement.

It is important to point out that there is no way to know what Lucas’s and Ophelia’s cards actually were.  All we need to know is that Lucas knew what both of them were.

Did you figure it out?  It takes a little bit of reasoning, but all the facts were there.

Now as I mentioned in the last installment, this time I’d give you a geometrical two-player game to work out.  I call it Splotch!

In the game of Splotch!, players alternate coloring in squares on a 4 x 4 grid.  The goal is to create a target shape, called a splotch.  A player wins when he or she colors in a square which completes a splotch, and then announces the win.

So if a player completes a splotch but doesn’t notice it and doesn’t announce the win, then play continues until someone completes another splotch.  You can only call Splotch! on your turn, so you cannot win by calling it if your opponent fails to.  It is also important to remember that the square you color in on your turn must be part of a splotch you announce.

In the version of Splotch! I’m sharing with you this week, the target splotch is:

Day119Splotch1

Just so you know how it works, let’s look at a sample game, shown below.

Day119Splotch2

There are two players, A and B.  A goes first, and plays in the lower left corner (labelled with A1).  B colors in a square in the top row (B1).  Then A’s second move is in the second row.  B wins on the next play by completing — and announcing! — a splotch.  The splotch may be rotated (as in this example), reflected, or even both!  So you’ve got to watch carefully.

Now admittedly, A was not a very clever player in this round of Splotch!  In fact, B could also have won by playing as follows:

Day119Splotch3

But here is the question:  In this version of Splotch!, which player can force a win every time?  Remember:  you must be able to provide a response to every move by your opponent!  I’ll reveal which player can force a win in my next installment of Beguiling Games, and I’ll share my particular strategy for winning.

One final remark — a bit of a tangent, but related to puzzles and games.  If you’ve been following my blog for a long while, you might remember my (fiendishly diabolical) number searches.  (These were posted well over a year ago.)

Day031Fig1

Here, the numbers in the right are in base 10, but you have to convert them to another base to find them in the grid!  You can read more about these puzzles here and here.

I submitted these puzzles to MAA Focus, the newsmagazine of the Mathematical Association of America.  I am happy to report that they will be featured on the Puzzle Page in the December 2017/January 2018 issue!

Now I will admit that this doesn’t exactly make me famous, given the number of people who subscribe to MAA Focus.  But I composed these puzzles specifically for my blog — so if I hadn’t decided to write a blog, these puzzles might never have been created.  Perhaps another reason to write a blog!

Stay tuned for the next round of Beguiling Games, where you’ll learn (if you didn’t already figure it out for yourself) who has a winning strategy in the game of Splotch!

Geometrical Dissections III: Octagons and Dodecagons

It has been quite a while since I’ve written about geometrical dissections.  For a brief refresher, you might want to look at my first post on dissections.

But recently my interest has been rekindled — to the point that I started writing a paper a few weeks ago!  I often like to share mathematics I’m working on as it’s happening to give you some idea of the process of doing mathematics.  The paper has quite a bit more mathematics in it than I’ll include in this post, but I’ll try to give you the gist of what’s involved.

Recall (again, see my first post for a more thorough discussion) that I’m interested in finding dissections that you can draw on graph paper — I find these more enjoyable as well as being accessible to a wider audience.  So all the dissections I’ll talk about will be based on a grid.

The first example is a dissection of two octagons to one, such as shown below.

Day118Dissection2

In other words, you can take the pieces from the two smaller octagons, move them around, and build the larger octagon.  If you look carefully, you’ll notice that the larger octagon is rotated 45° relative to the smaller octagons.  Geometrically, this is because to get an octagon twice the area of a given octagon, you scale the side lengths by \sqrt2.  Imagine a square — a square with side length S has area S^2, while a square with side length \sqrt2S has area (\sqrt2S)^2=2S^2  — which is double the area.

Now think of a segment of unit length.  To get a segment of length \sqrt2, you need to take a diagonal of a unit square, which rotates the segment by 45° as well as scales it by a factor of \sqrt2.  This is why the larger octagon is rotated with respect to the smaller ones.

But what makes this dissection interesting is that there is an infinite family of very similar dissections.  By slightly varying the parameters, you get  a dissection which looks like this:

Day118Dissection3

Here, you can clearly see the 45° rotation of the larger octagon.  I always enjoy finding infinite families of dissections — it is very satisfying to discover that once you’ve found one dissection, you get infinitely many more for free!

The proof that this always works (which I will omit here!) involves using a geometrical argument — using arbitrary parameters — to show that the green triangles always have to be right isosceles triangles.  This is the essential feature of the dissection which makes it “work” all the time.

The second example I’m including in the paper is a dissection on a triangular grid, like the one below.

Day118Dissection4

Note that the figure on the left is an irregular dodecagon; that is, it has twelve sides.  Recall that the interior angles of a regular dodecagon have measure 150° — but so do the angles of this irregular dodecagon as it is drawn on a triangular grid.

If you look carefully, you’ll see how the sides in the pieces of the dissection on the right match up with sides of the same length from the other pieces.  Also, looking at the dissection on the right, you’ll see that around all the interior vertices, there are two angles with measure 150° and one with measure 60°, adding up to 360° — as we would expect if the pieces fit exactly together.

And — as you might have guessed from the first example — this is also one of an infinite family of dissections.  As long as the sides of the irregular dodecagon alternate and the vertices stay on the triangular lattice, there is a dissection to a rhombus.  Below is another example, and there are infinitely many more….

Day118Dissection5

My third and final example involves irregular dodecagons, but this time on a square grid.  And while I found the previous two dissections several years ago, I found this example just last week!  What inspired me was one of my favorite dissections — from an irregular dodecagon to a square — also found many years ago.

Day118Dissection1

In the spirit of the first two examples, I asked myself if this dissection could be one of an infinite family.  The difficulty here was that there were three parameters determining an irregular dodecagon, as shown below.

Day118Dodecagon

We do need b>c 
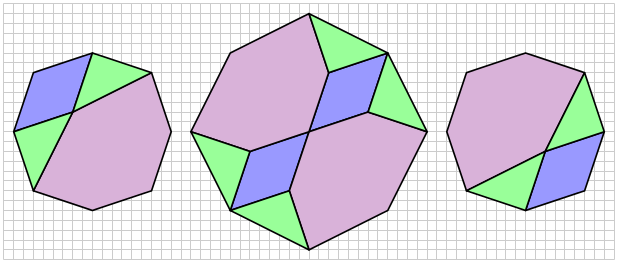
so that the dodecagon is convex and actually has 12 sides; if b=c, four pairs of sides are in perfect alignment and the figure becomes an octagon.

There is an additional constraint, however, which complicates things a bit.  The area of this dodecagon must also be the area of some tilted square with vertices on the grid, as illustrated below.  Note that the area of this square is just d^2+e^2.

Day118Square

It is not a difficult geometry exercise to show that the area of the dodecagon is a^2+4(a+b)(c+b).  So in order to create a dissection, we must find a solution to the equation

a^2+4(a+b)(c+b)=d^2+e^2.

Again, here is not the place to go into details.  But it is possible to find an infinite family of solutions when a=e.  You get a dissection which looks like this:

Day118Dissection6

I was particularly pleased to have found this eight-piece dissection since most of my attempts until this point had ten pieces or more.  And to give you a sense of this family of dissections, here is an example with different parameters within this family.

Day118Dissection7

You can definitely see the resemblance, but it is also clear that the dodecagon and square are not the same shape as those in the previous dissection.

So these are the three families of geometrical dissections I’ll be including in my paper.  I hope these examples might inspire you to pick up a pencil and graph paper and try to find some infinite families of your own!