Another successful meeting of the Bay Area Mathematical Artists took place yesterday at the University of San Francisco! It was our largest group yet — seventeen participants, include three new faces. We’re gathering momentum….
Like last time, we began with a social half hour from 3:00–3:30. This gave people plenty of time to make their way to campus. I didn’t have the pleasure of participating, since the campus buildings require a card swipe on the weekends; I waited by the front door to let people in. But I did get to chat with everyone as they arrived.
We had a full agenda — four presenters took us right up to 5:00. The first speaker was Frank A. Farris of Santa Clara University, who gave a talk entitled Fibonacci Wallpaper Spirals.

He took inspiration from John Edmark’s talk on spirals at Bridges 2017 in Waterloo, which I wrote about in my blog last August (click here to read more). But Frank’s approach is rather different, since he works with functions in the complex plane.
He didn’t dive deeply into the mathematics in his talk, but he did want to let us know that he worked with students at Bowdoin College to create open-source software which will allow anyone to create amazing wallpaper patterns. You can download the software here.
Where do the Fibonacci numbers come in? Frank used the usual definition for the Fibonacci numbers, but used initial values which involved complex numbers instead of integers. This allowed him to create some unusually striking images. For more details, feel free to contact him at ffarris@scu.edu.
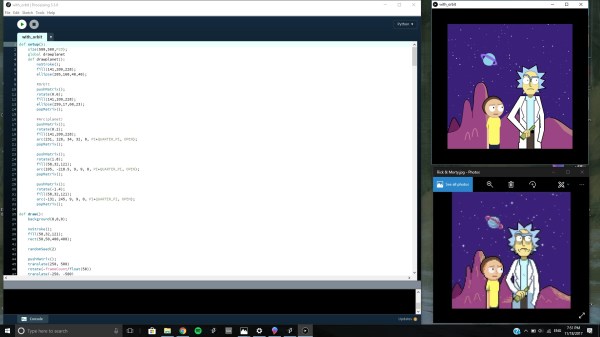
Next was our first student talk of the series, My Experience of Learning Math & Digital Art, given by Sepid Ebrahimi. Sepid is a student in my Mathematics and Digital Art course; she is a computer science major and is really enjoying learning to code in Processing.
First, Sepid mentioned wanting to incorporate elements into her work beyond simple points, circles, and rectangles. Her first project was to recreate an image of Rick and Morty, the two main characters in the eponymous cartoon series. She talked about moving from simple blocks to bezier curves in order to create smooth outlines.
Sepid then discussed her second project, which she is using for her Final Project in Mathematics and Digital Art. In order to incorporate sound into her work, she learned to program in Java to take advantage of already-existing libraries. She is creating a “live audio” program which takes sound input in real time, and based on the frequencies of the sound, changes the features of various geometrical objects in the video. Her demo was very fascinating, and all the more remarkable since she just started learning Processing a few months ago. For more information, you can contact Sepid at
sepiiid.ebra@gmail.com.
The third talk,
Conics from Polygons: the Chord Ratio Construction, was given by Scott Vorthmann. He is spreading the word about
vZome, an open-source virtual environment where you can play with Zometools.
The basis of Scott’s talk was a simple chord ratio construction, which he is working on with David Hall. (
Here is the GeoGebra worksheet if you would like to play with it.) The essential idea is illustrated below.
Begin with two segments, the red and green ones along the coordinate axes. Choose a ratio r. Now add a chord parallel to the second segment and r times as long — this gives the thick green segment at y = 1. Connect the dots to create the third segment, the thin green segment sloping up to the right at x = 1. Now iterate — take the second and third segments, draw a chord parallel to the second segment and r times as long (which is not shown in the figure), and connect the dots to form the fourth segment (the thin green segment sloping to the left).
Scott then proceeded to show us how this very simple construction, when iterated over and over with multiple starting segments, can produce some remarkable images.
Even though this is created using a two-dimensional algorithm, it really does look three-dimensional! Conic sections play a fundamental role in the geometry of the points generated at various iterations. Quadric surfaces in three dimensions also come into play as the two-dimensional images look like projections of quadric surfaces on the plane. Here is the
GeoGebra worksheet which produced the graphic above. For more information, you can contact Scott at
scott@vorthmann.org.
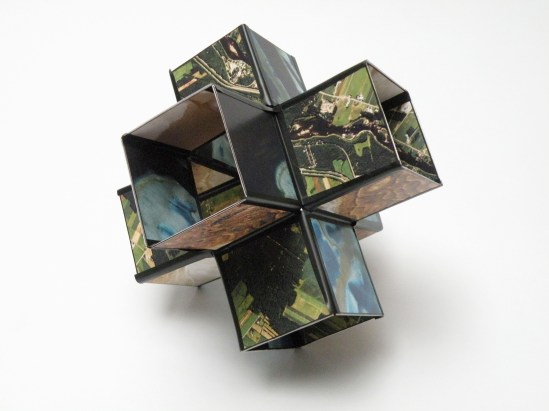
The final presenter was Stacy Speyer, who is currently an artist-in-residence at Planet Labs. (
Click here to read more about art at Planet Labs.) She didn’t give a slideshow presentation, but rather brought with her several models she was working on as examples of
Infinite Polyhedra Experiments with Planet’s Satellite Imagery.One ongoing project at Planet Labs is planetary imaging. So Stacy is taking high-resolution topographical images and using them to create nets for polyhedra. She is particularly interested in “infinite polyhedra” (just google it!). As you can see in the image above, six squares meet at each vertex, and the polyhedron can be extended arbitrarily far in all directions.
One interesting feature of infinite polyhedra (as you will notice above) is that since you cannot actually create the
entire polyhedron, you’ve got to stop somewhere. This means that you can actually see
both sides of all the faces in this particular model. This adds a further dimension to artistic creativity. Feel free to contact Stacy at
cubesandthings@gmail.com for more information!
We’ll have one more meeting this year. I am excited to see that we’re making so much progress in relatively little time. Presentations next time will include talks being prepared for the Joint Mathematics Meetings in San Diego this coming January, so stay tuned!