More on: What is…Inversive Geometry?

The more I thought about it, the more I realized I just couldn’t stop at just one post on inversive geometry.  There is so much interesting geometry to discuss….

Cardioid

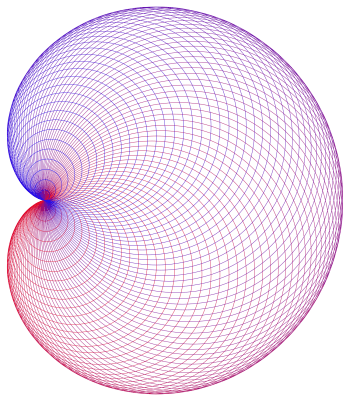
This image of a cardioid, made up of a collection of tangent circles, is one of my favorite geometrical constructions.  It’s created by beginning with a base circle (in black).  Choose any point on the circle (like the one in black), which we take to be the origin.

Cardioid2.png

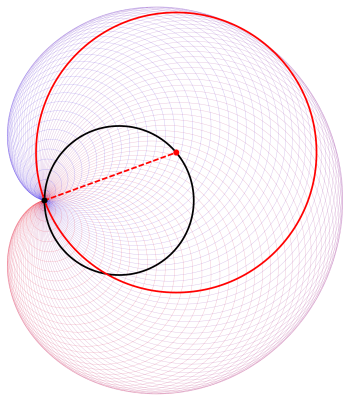
Now for any other point on the black circle (like the point in red), draw a circle with that point as center, and the radius as the distance from the origin, as in the figure.  If you do this several times, the circles you draw will envelope a cardioid.

Why do you get a cardioid?  It’s actually not too difficult to prove using inversive geometry.  We won’t go through all the details, but you’ll see enough to get the gist of the proof.

So let’s go!  There’s actually a lot going on once you’ve added the point at infinity, ω.  If you’ve forgotten about ω, you might want to look at Day091 to refresh your memory.  One property of ω which will be important to our discussion today is that ω lies on any curve which is unbounded.  And the simplest unbounded curve is just a line.

So imagine a line, and some point P on that line.  Now chose a direction long the line, and think about moving along the line in that direction.  What happens?

Well, eventually, you’ll start moving further and further away from the origin.  And as you keep moving further from the origin, you’re actually moving “closer” to the point at infinity.  Not closer in a numerical sense of the distance from ω, since you are always infinitely far away from ω.  But closer in the sense that the line “ends” at the point at infinity.  If ω lies on the line, you’ll need to able to get there — even it takes forever….

Yeah, a bit to wrap your head around.  But it gets even better!  Think back to where you started — the point P — and then move along the other direction along the line.  Keep going…as you approach the point at infinity from the other side of the line.

Do you see what’s happening?  Both ends of the line actually meet at ω!  Yes, the line is a closed curve in inversive geometry, like a circle is in Euclidean geometry.

We’ll come back to this point in a moment, but next we want to ask the following question:  what is the inverse curve of a line?  Recall that the inverse curve of a line is that curve obtained by taking all the individual points on a line, and then taking all of their inverse points.

Interestingly, the inverse curve turns out to be a circle — and not just any circle, but a circle which goes through the origin.  As the proof isn’t all that difficult, we’ll take a few moments to work through it.

figuresinv2

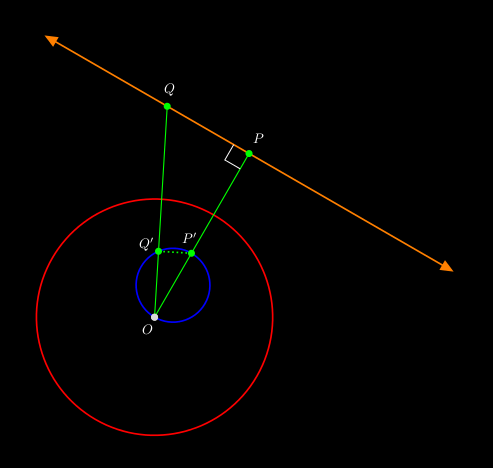
So suppose the red circle centered at O has radius 1, and choose a point P.  Now draw the line through P such that the segment OP is perpendicular to the line, and consider another point Q on this line.  Thus, triangle OPQ has a right angle at P.

Since the point at infinity, ω, is on the line, its inverse point, ω′ = O, must lie on the inverse curve.  Thus, the inverse curve (shown in blue) must pass through the origin. Of course P and Q′, the inverse points of P and Q, must also lie on the inverse curve.

Then by the property of inverse points, [OP]\cdot[OP']=[OQ]\cdot[OQ']=1, and so

\dfrac{[OP]}{[OQ]}=\dfrac{[OQ']}{[OP']}.

But because inverse points lie on the same ray through the origin, then \angle POQ and \angle Q'OP' must have the same measure, making triangles \Delta POQ and \Delta Q'OP' similar triangles.

What does this mean?  This implies that \angle OQ'P' is also a right angle.  To summarize:  given any point Q on the line, its inverse point Q′  has the property that when joined to O and P′, a right triangle is formed with a right angle at Q′.

But because any triangle inscribed in a semicircle is a right triangle, this means that the set of all inverse points Q forms a circle with diameter OP′.  Neat!

Thinking back to ω being on the line, we see that as we begin at P and move either direction along the line toward the point at infinity, here’s what we’re doing on the inverse curve:  we’re starting at the point P′ and moving either direction around the circle toward the origin.  It really does make sound geometrical sense.

Will this work for any line?  If you think about it for a moment, you’ll find that it does…almost.  Our geometrical argument fails if the line actually goes through the origin.  But it shouldn’t be difficult to convince yourself that the inverse curve of a line going through the origin is actually the same line!  The two points where the line intersects the circle of inversion stay in the same place, but the other points switch in pairs.

Where are we going with all this?  It turns out that adding the point at infinity does, in some sense, make lines behave like circles — we can even imagine a line as a “circle with infinite radius.” And where is the center of this circle of infinite radius?  The point at infinity, of course….

As mentioned last week, the inverse curves of circles not passing through the origin are also circles not passing through the origin.  To summarize:

  • Inverses of circles not passing through the origin are also circles not passing through the origin;
  • Inverses of circles passing through the origin are lines not going through the origin (and vice versa);
  • Inverses of lines through the origin are also lines through the origin, and each such line is its own inverse.

Now here’s the next step.  Given the close relationship between lines and circles in inversive geometry, we define a Circle in inversive geometry (capital “C”, like we did in spherical geometry) to be either a line or circle.  Then here’s the revised summary:

  • Inverses of Circles are Circles.

Beautifully simple.  The ability to make simple statements like this with real geometrical meaning is one more reason why inversive geometry it so very interesting.

And with that, we’ll have to call it a week….  In the next (and final) post on inversive geometry, we’ll briefly look at the algebra of inverse curves, and finish the cardioid construction mentioned above.  Until then!


Mathematics and Digital Art: Final Update

It’s hard to believe yet another academic year is over!  I do think this second semester of Mathematics and Digital Art went a little more smoothly than the first.  This shouldn’t be too surprising, though — the first time implementing any new course is a little bumpy.  Though I must admit, there were surprisingly few bumps the first time around….

Like last semester, I had students create a movie in Processing.  The main tool I had them use was linear interpolation to create animation effects.  As before, I encouraged them to use linear interpolation with any numerical parameter in their movie — how much red there is in the background color, the position of objects on the screen, or the width of points and lines, just to name a few possibilities.

Colette created some interesting visual effects.  Some students (like her) took advantage of the fact that if you don’t set the background color in the draw function in Processing, successive calls to the draw function overlap the previous ones, giving a sense of movement.


Peyton was inspired when her friends invited her to go to the beach.  Here is a screen shot of her movie, where the moon reflects off the rippling waves of the sea at Ocean Beach in San Francisco.

PeytonMovie

Next, I’d like to share a few pieces from students’ Final Projects.  Recall that Final Projects are an important part of the course — during the second half of the semester, we spend one or two days a week working on them.  This is the opportunity for students to explore any aspect of the course in more detail.

While Lainey focused on making images which reminded her of her dreams, she began with this collage including  several motifs from our coursework throughout the semester.  She was one of the few to incorporate L-systems into her Final Project.

FinalPresentation-ElaineTousignant


Karina, as many students did, experimented with image processing.  She wanted to overlay multiple images at various transparencies to create a kaleidoscopic effect.  Rotating the images required that she brush up on her trigonometry….

Karina


Karla was interested in experimenting with color.  She was interested in morphing images of the Buddha.  Karla used the RGB values of the pixels in an original image, like the one shown below on the left, to determine the RGB values of the pointillistic image shown on the right.

KarlaFinal

Also like last semester, I asked students to write a final response paper about their experience with the digital course.  The responses were similar to those of last semester, so I’ll only include a few excerpts here.

I think differently about mathematics in how it relates to art. I always thought that the two would be separate entities, but this class has proved that’s not always the case.

After having taken this course this semester I really have gained an interest in art and programming that I certainly didn’t have before, even after having taken some courses in programming. I think that actually being able to see the endless things that are able to be created using programming and math is really cool….

One student made a particularly interesting remark:

I wish that I had more knowledge on how to type my own code. There were points in the semester where the art I was creating felt a bit like a coloring page where we were given a page that was already drawn and told to fill it in and try to make it our own.

Of course this is what I want to read!  I do want to inspire students to investigate programming further — but students taking this course receive a mathematics credit.  There is certainly no doubt in your mind about how passionate I am about having students learn to write code, but I do need to emphasize the mathematics of digital art.  Maybe next semester I’ll have Nick run some extra sessions on coding for those who are interested in learning more.

I also wanted to share some work from the other course I taught this semester, Linear Algebra and Probability.  I have students work with affine transformations and iterated function systems in this course as well.  Their first project is a still image using Sage, and their second project is a fractal animation using Processing.  Here is Jay’s submission.


And finally, I want to remind you that Mathematics and Digital Art is becoming a university-wide course next year.  I am working with the Fine Arts department here at USF to encourage incoming fine arts majors to earn their mathematics credit by creating digital art!  I expect the course to be quite a bit larger this Fall, and will be connecting with the Fine Arts faculty to make sure the content meets their needs as well.

In addition, I will be giving a talk at Bridges this summer (in Waterloo, (the Canadian one, that is)) about my digital art course.  I’m expecting that I’ll receive a wide range of comments and suggestions, so the course may be a little different in the fall.  That’s one nice feature of this course — it’s not a prerequisite for any other course, so there is some flexibility as far as content is concerned.

Like this semester, I’ll provide monthly updates to let you know what changes I’ve implemented, and also to showcase student work.  So stay tuned!

On Cheese: Reprise

I haven’t repeated a post yet — but as I’m getting ready for Final Exams, I thought it appropriate.  I posted this satire over a year ago, but of course it is still relevant.  The traditional system of assigning grades as a measure of, well, anything, is woefully inadequate.  Continue reading at your own peril….

On Cheese

A new semester is about to start! Finally, those students we have worked so hard to prepare are ready to learn The Calculus!  (Note: We do not teach The Calculus, but rather facilitate its learning.)

With class Roster in hand, we make for the Cheesemonger. (Mr. Hadley has been here for decades.) “Mr. Hadley, twenty-one, if you please,” I say, handing him my Roster. That is all there is to it. The next morning, twenty-one perfectly crafted cubes of Preferred Cheese (each having a mass of precisely 100g) are in my class Cupboard — one for each student, clearly labelled. We are ready!

Of course the students’ initial enthusiasm is high, until the inevitable First Exam. Surely much of the material is review — so we use the Petite grater to shave off a small bit of cheese from a student’s Block when they make the inevitable First Mistake. (There is always the exception, naturally — the Micro is used for sign errors, as well as trivial arithmetic errors.) This is done to accurately track students’ progress.

As the semester progresses, the situation becomes more dire. More egregious errors require the use of a Usual grater, while blocks of students who neglect to turn in entire assignments surely warrant being shaved by an Ultra. After years of experience, we are able to gauge precisely how much cheese must be shaved for each particular type of error. (Truly, it is all in the wrist.)

The end draws near — and although well-acquainted with the system, students still worry about the mass of their Block. They must realize that what is done is done — and No!, it is not possible to replenish the cheese! Is there no justice? They have been warned aplenty, but it is not our fault they do not heed our omens.

We are particularly meticulous with the shaving of the Final Exam — as it is an important assessment. Certain errors now warrant more grievous penalties — the Micro is no longer relevant. Beware the sign error!

But the wonders of being Complete! As a result of our experience (and training, naturally — Mr. Hadley is quite the Cheesemonger), the mass of each student’s Block represents their understanding of The Calculus entirely! Moreover, this mass may be converted to any number of convenient units — a percentage, perhaps, or one of various letters meant to convey a State of Understanding. But the work of the Facilitator is done! We rest well, and enjoy our cuppa. (Yes, some decry the fairness of such a system. No matter. Surely it is the best possible.)

On Coding IX: Computer Graphics I

It has been some time since an On Coding installment, and I thought it finally time to discuss computer graphics.  Of course I’ve done that a lot already, as far as several applications go.  For this post, I asked myself something different:  what do I use computer graphics for?

2017-05-04BinaryTreeLambdais01.png

I had never really taken a step back to look at the larger picture, but that’s one of the purposes of this thread.  I came up with seven major uses, in roughly chronological order from when I started using graphics in each way:

  1. Creating fractals.
  2. Graphic design.
  3. Rendering polyhedra in three dimensions.
  4. Mathematical illustration.
  5. Web design.
  6. Mathematical art.
  7. Research.

Today, I’ll give a brief overview, and follow up in future posts with more details about the various platforms I’ve used.

I don’t need to say a lot about the first two uses, since I’ve discussed them in some detail in my posts on Postscript and iterated function systems.  My interest in fractals has of course continued, especially given my passion for Koch curves and binary trees.  I work less with graphic design now — I used to design stationery and business cards for myself and friends, but now that communication is so largely electronic, there is less of a need.  But I do still occasionally design business cards using my art logo, print them onto cardstock, and cut them myself when I need to.

Day092c2016Vienna

I also spend quite a bit of time designing title and separator slides for presentations.  (I frankly admit to never having created a PowerPoint presentation in my entire life.  Yuck.)  I now exclusively use TikZ in LaTeX since you have complete control over the graphics environment.

Day092a

I haven’t mentioned polyhedra extensively on my blog so far, but my interest in three-dimensional geometry goes back to my undergraduate days.  When I started teaching college for the first time, I designed (and eventually wrote a textbook for) a course on polyhedra based on spherical trigonometry.

The main tool I used early on was Mathematica, and when I redid all my graphics for my textbook about five years ago, I used Mathematica.  The image you see above was rendered using POV-Ray, a ray-tracing package which allows the user to specify a wide range of parameters to create realistic effects.  You can see shadows and a reflection as if the polyhedron were sitting on a shiny, black surface.  And while the images generated by POV-Ray are quite a bit nicer than those created with Mathematica, they take more time and effort to create.

Mathematical illustration covers a wide range of uses.  Drawing figures for a mathematical paper perhaps first comes to mind.  I used a package called PSTricks for quite a while (since the “PS” stands for Postscript), but once I learned about TikZ, I changed over fairly quickly.  This means I needed to re-render many older graphics (especially in my textbook) — but since for both packages you need precise coordinates, I already had all the mathematics worked out for the PSTricks function calls.  So converting to TikZ wasn’t all that problematic.  I will be talking in more detail about TikZ in a future post.

Day092b

Of course there are also geometrical puzzles and problems, as I’ve discussed before on my blog.  Nicely formatted graphics go a long way in making a puzzle appealing to the reader.

Web design is especially important, since I rely so much on my website for everything.  I have a web page for my artwork, for my publications, talks, and anything I do professionally.  I strive for functionality and aesthetics.  I’m also a minimalist as far as design goes — “less is more.”

Also important is ease of use for me.  It’s not hard to add something to my homepage.  I don’t have the time (or interest) in redesigning my homepage every I want to add a new link.  I’m not a fan of hiding everything in dropdown menus — I want the user to glance at my site, and immediately click on the relevant link without having to pore through menus.

Mathematical art has actually been a fairly recent use of computer graphics for me — I only really started getting into it about four years ago.  I don’t feel I have to say a lot about it right here, since it is a common thread throughout so many of my posts.  You can visit my art website, or look at my Twitter, where I try to update daily (as much as I can) with new and interesting pieces of mathematical art.

Finally, I’d like to say a word about the last use of computer graphics:  research.   I think this is extremely important, especially with the exploding world of data visualization.  Really, this has been perhaps Nick’s and my most important tool when it comes to studying binary trees.

2017-02-10tree1

Without going into too much detail about this image, is consists of six scaled and rotated copies of one tree (the ones in color) and a related dual tree (in white).  Now count the number of leaves (ends of paths) in common with the colorful trees — and you’ll count 1, 5, 10, 10, 5, and 1.  These are, of course, binomial coefficients:  row 5 of Pascal’s triangle.

Why is this the case?  And is there some general result to be proved?  The point I’m making is that when Nick and I create routines to display different trees or combinations of trees, we look at lots of examples, and seek recurring themes.

We learn a lot by doing this, and the direction of our research is heavily influenced by what we observe.  This might not be so surprising, since after all, fractal trees are such geometrical objects.  I can honestly say the pace of our progress in making conjectures is directly linked to our ability to produce large numbers of trees and knowing what to look for.

So that’s what I use computer graphics for!  In future posts, I’ll discuss the various software packages I use, and try to give some idea of the advantages and disadvantages of each.  I’ll give special emphasis to those that are open-source — there is so much out there that is free to download, anyone interesting in computer graphics will have no difficulty finding something interesting to experiment with!