Mathematics and Digital Art: Final Update (Fall 2017)

Yes, it is the end of another semester of Mathematics and Digital Art!  It was a very different semester than the first two, as I have mentioned in previous posts, since I began the semester with Processing right away.  There are still a few wrinkles to iron out — for example, we had a lab project on interactivity (involving using key presses to change features of the movie as it is running) which was quite a bit more challenging than I expected it would be.  But on the whole, I think it was an improvement.

So in this final post for Fall 2017, I’d like to share some examples of student work.  In particular, I’ll look at some examples from the Fractal Movie Project, as well as examples of Final Projects.

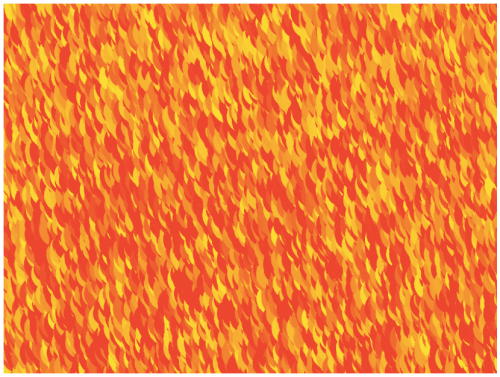
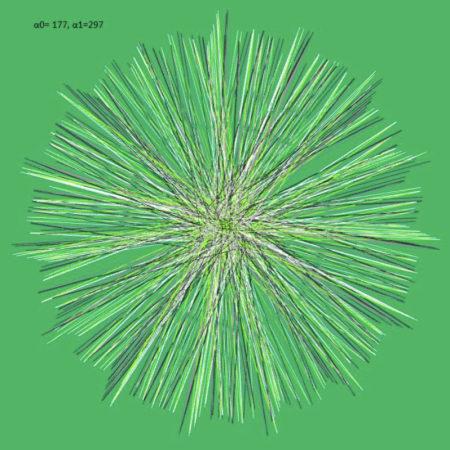
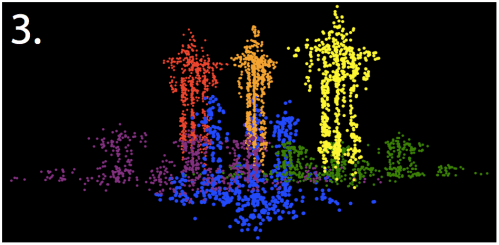
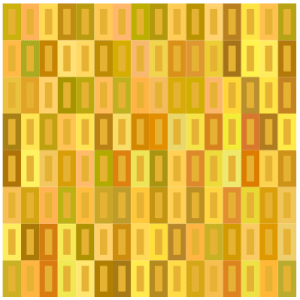
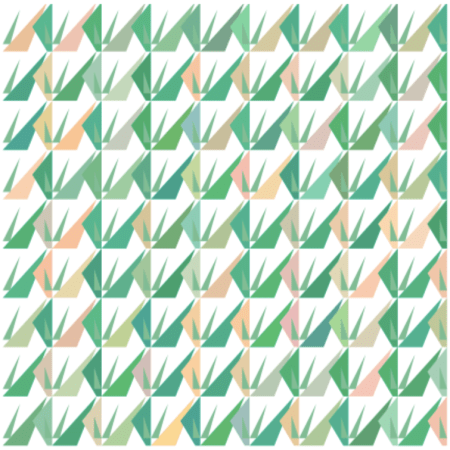
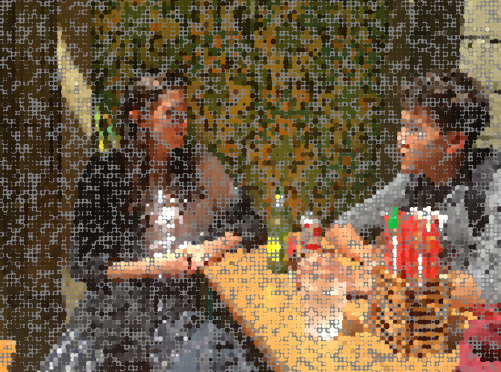
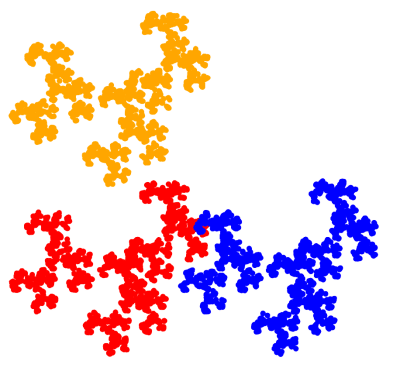
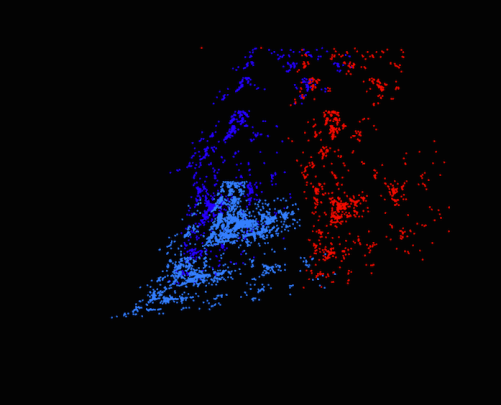
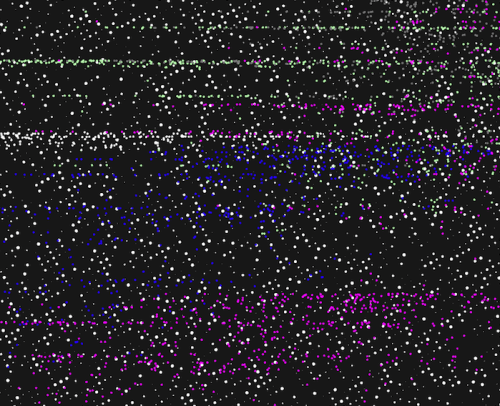
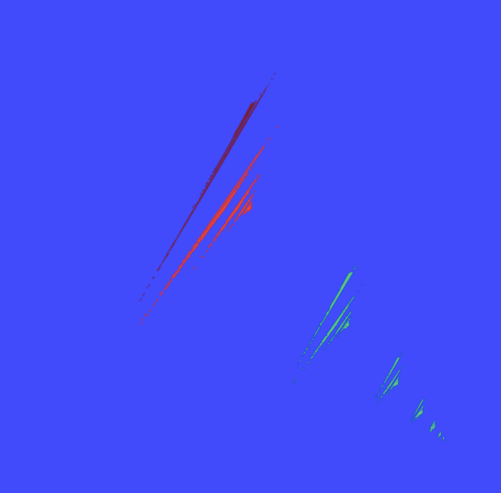
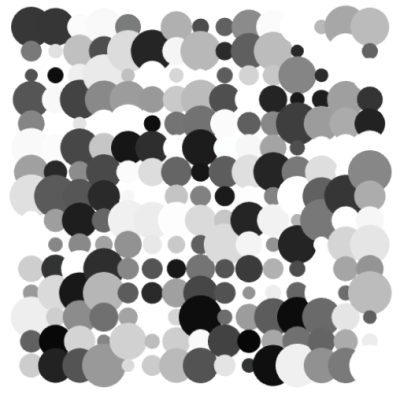
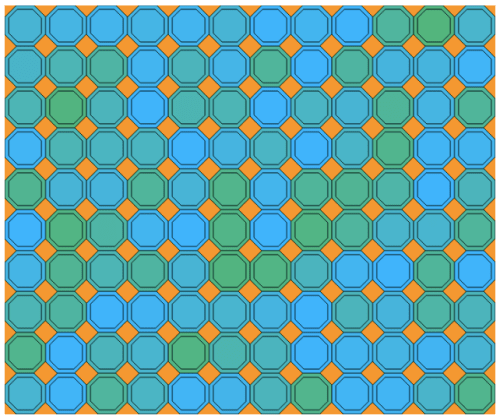
Recall that the Fractal Movie Project involves using linear interpolation on the parameters in affine transformations in order to make an animated series of fractal images.  One student experimented with a bright color palette against a black background.  As the fractal morphed, it actually looked like the red part of the image rotated in three dimensions, even though the affine transformations were only two-dimensional.

MAK


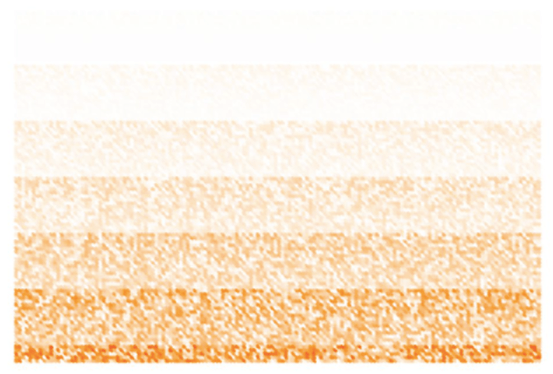
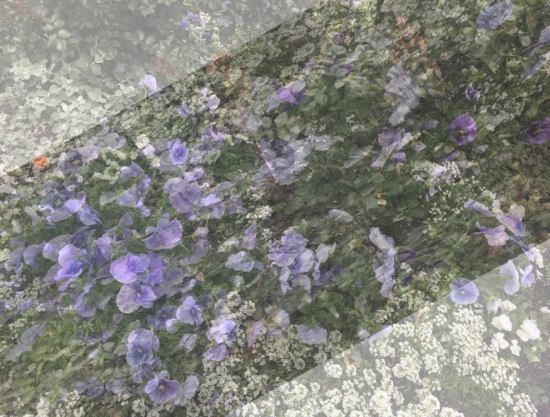
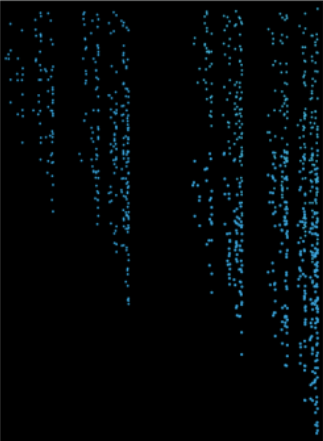
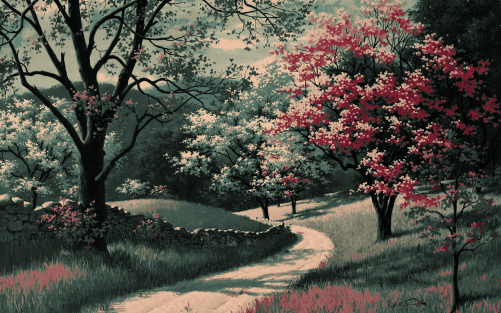
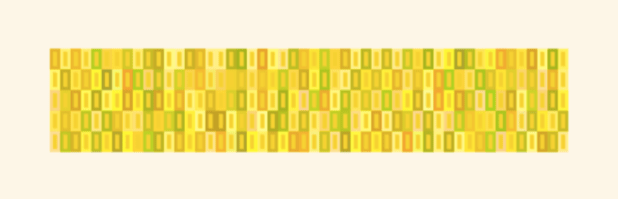
Cissy wanted to explore the motion of rain in her movie.  Although she began with bright colors on a black background, once she saw her fractal in motion, she decided that more subtle colors on a white background would be better suited to suggest falling raindrops being blown about by the wind.MCissy


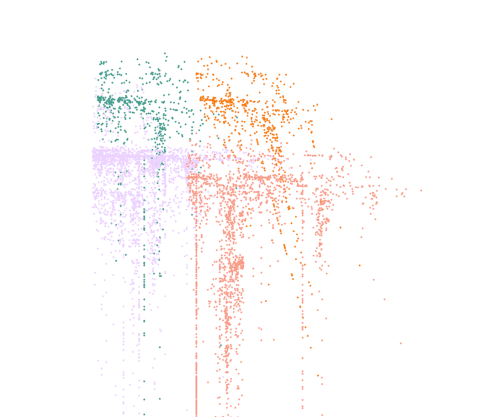
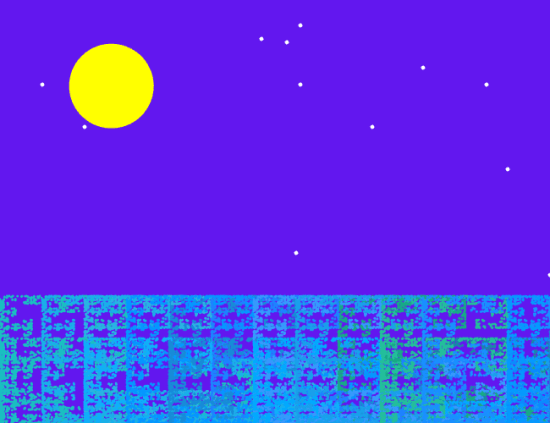
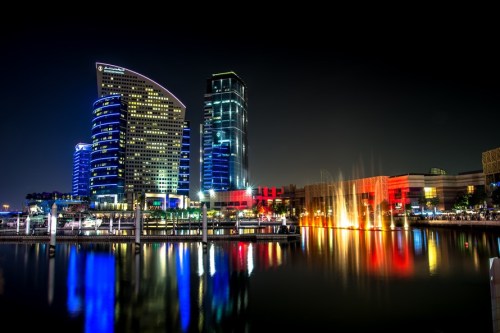
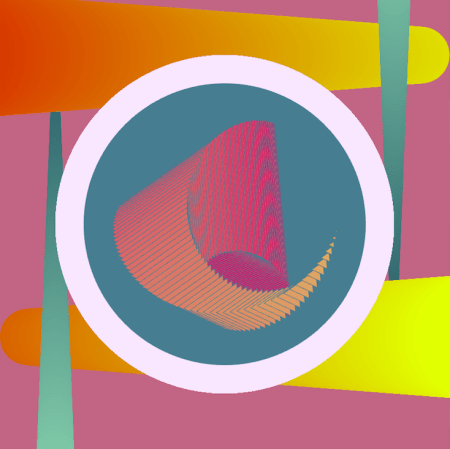
Sepid also incorporated movement in her movie — she created a rotating galaxy with a color palette inspired by the colors of the Aurora Borealis.  In addition, she learned how to use the Minim library so she could incorporate sound into her movie as well.  Here is a screen shot from her movie.

MSepid


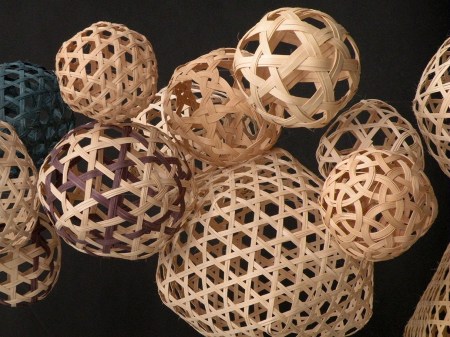
Now let’s take a look at a few Final Projects.  Recall that these projects were very open-ended so that students could go in a direction of their choice.  Some really got into their work, with truly inspirational results.  The presentation that Sepid gave at a recent meeting of the Bay Area Mathematical Artists was actually work she was doing on her Final Project (read about it here).

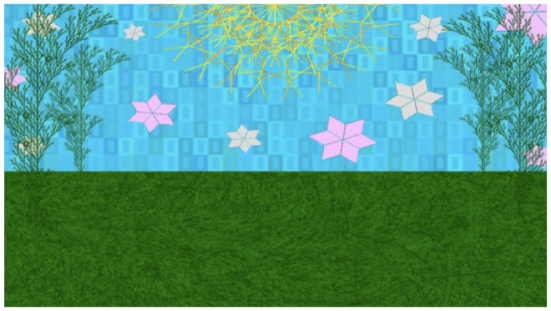
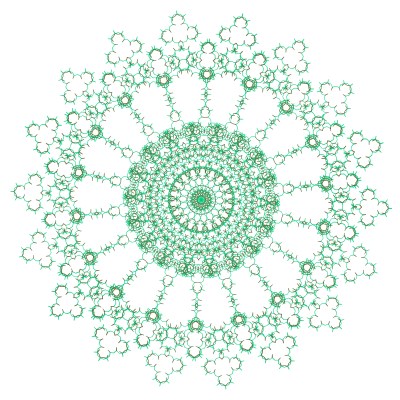
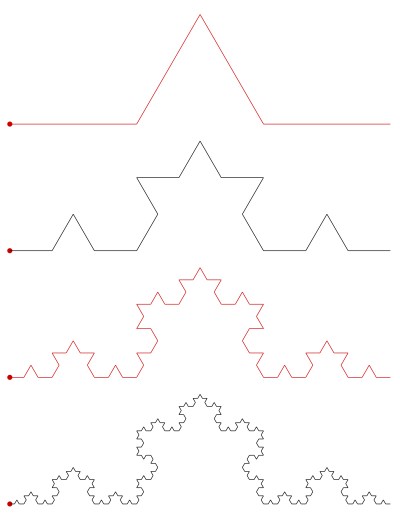
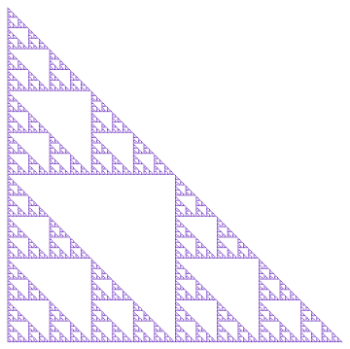
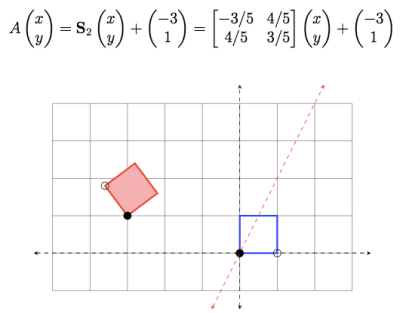
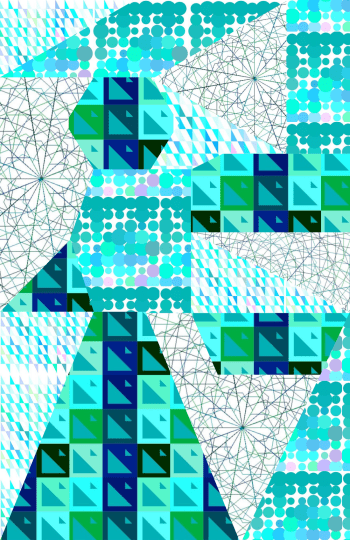
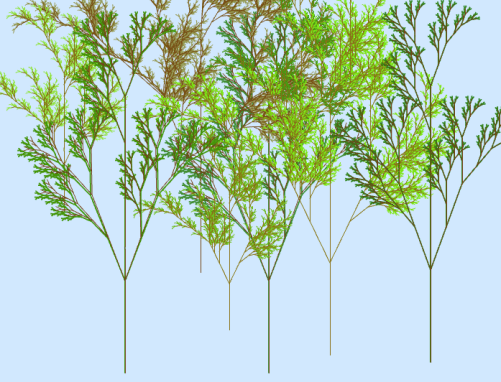
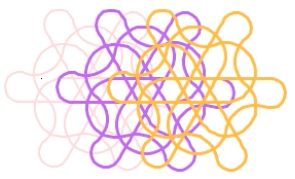
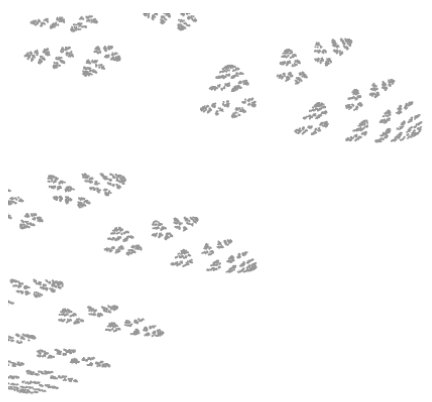
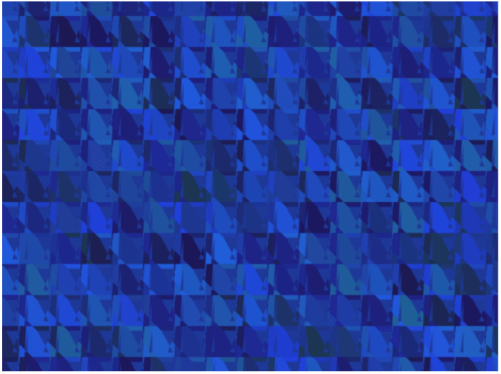
Terry took on an ambitious project. She based her work on a Bridges paper by Adam Colestock, Let the Numbers Do the Walking: Generating Turtle Dances on the Plane from Integer Sequences (read the paper here).  Terry did have some programming experience coming into the course, and so she decided to code all of Adam’s turtle graphics algorithms from scratch! This was no simple task, but she worked hard and eventually accomplished her goal.

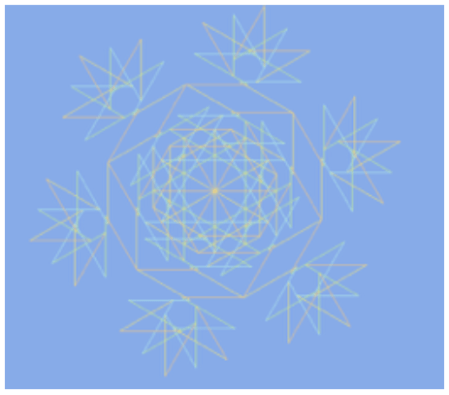
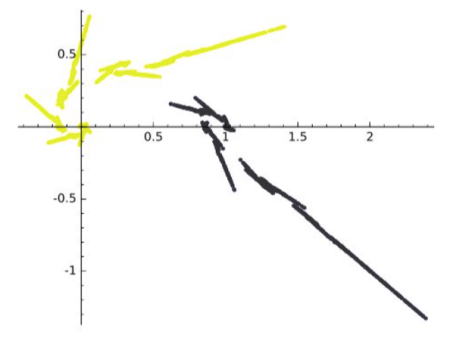
Here is a screen shot from one of her movies; Terry wanted to create an interesting visual effect by overlaying multiple copies of the same turtle path.  Since this particular path was not too dense in the plane, she was able to work with thicker lines.

FPTerry

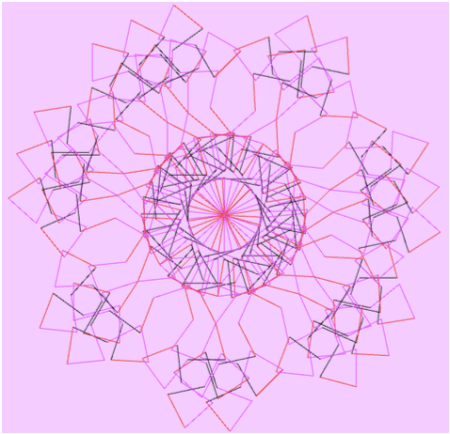
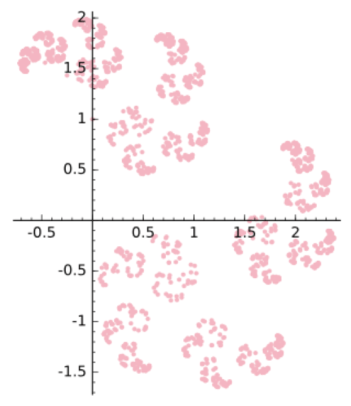
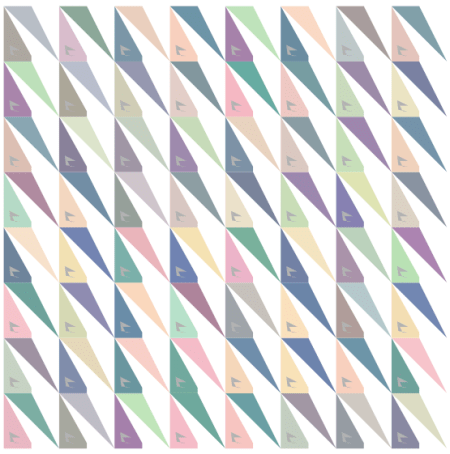
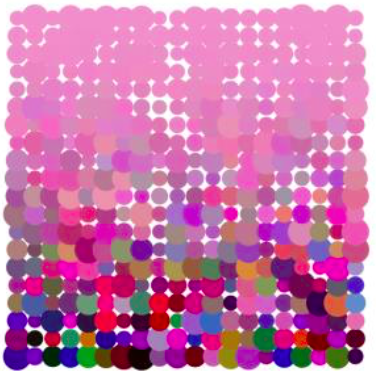
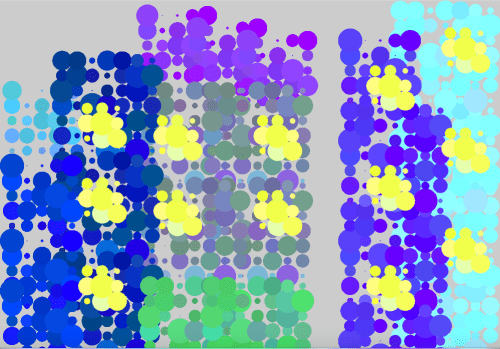
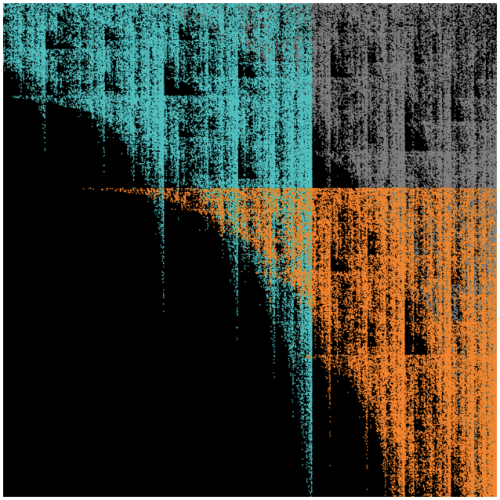
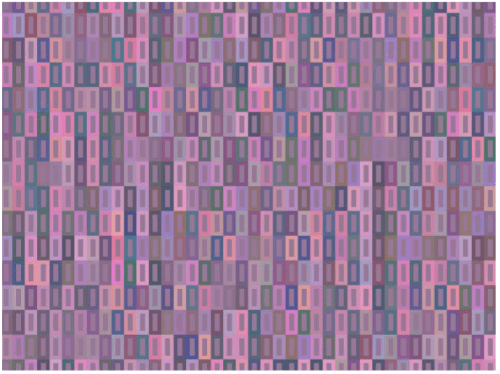
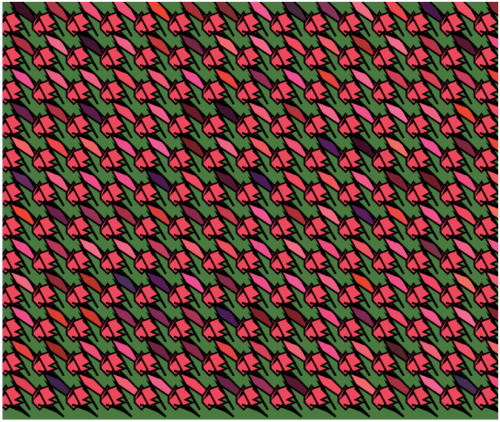
Tera created a movie which involved rotating triangles and moving dots.  Her movie had a strong sense of motion, and incorporated a vibrant color palette. She remarked that working with color in this project was both fun and quite challenging. In her words, “Playing nicely with hot pink is not an easy feat.”

FP_TG


I would also like to share the fact that Professor Roza Aceska of Ball State University (Muncie, Indiana) will be teaching a course about digital art next semester using Processing which will be incorporating a lot of my course materials.  I am very excited about this!  Many faculty who come to my talks say they are interested in teaching such a course, but getting Department Chairs and Deans to approve such courses is sometimes an uphill battle.

Professor Aceska’s course will be a bit different from mine — her course is in the Honors Program, and as such, does not count as a mathematics credit.  So she will not have most of the mathematics assignments and quizzes that I had in my course.  But she will still be emphasizing the fascinating relationship between mathematics, programming, and art.  I hope to write more about her course sometime during the next semester.

One final remark — I am helping to organize a Mathematical Art Exhibition at the Golden Section Meeting of the Mathematical Association of America on February 24, 2018 at the California State University, East Bay.  So if you’re reading this and are in the Bay Area and would like to submit some mathematical art for inclusion in our exhibit, please let me know!


Mathematics and Digital Art: Update 2 (Fall 2017)

We’ve just completed Week 8 of the Fall semester, so it’s time for the next update on my Mathematics and Digital Art class!  As I had mentioned before, the major difference this semester was starting with Processing right from the beginning of the semester.

It turns out this is making a really big difference in the way the class is progressing.  The first two times I taught the course, I had students work in the Sage environment for the first half of the semester.  The second half of the semester was devoted to Processing and student projects.

Because students only started to learn Processing at the same time they were diving into their projects, they were not able to start off with a Processing-based project.  As it happened, a few students actually incorporated Processing into their final projects as the second half of the semester progressed, but this was the exception, not the rule.

But last week, we already started making movies in Processing!  Starting simply, of course, with the dot changing colors.


This was a bit easier to present this time around, since we already had a discussion of user space vs. screen space earlier in the semester.  So this time, I could really focus on linear interpolation — the key mathematical concept behind making animations.

Next week will be a Processing-intense week.  I’ll delay some topics — like geometric series — to a little later in the course so we can get more Processing in right now.  The reason?  I really think many students will involve Processing in their final projects in a significant way.  I want to make sure they have enough exposure to feel confident about going in that direction for their final projects.  I’ll let you know what happens in this regard in my next update of Mathematics and Digital Art.

Now for some examples of student work!  For the assignment on iterated function systems, students had three different images to submit.  The first was a Sierpinski triangle — I asked students to create an image simultaneously as close to and as far away from a Sierpinski triangle as possible.  The idea was that a viewer should recognize the image as being based on a Sierpinksi triangle, but perhaps only after staring at it for thirty seconds or so.

This is Sepid’s take on the assignment.  On many of her pieces, she experimented with different ways to crop the final image.  This has a significant effect on the image’s final appearance.

Day115Sepid1.png


This is Cissy’s submission for the Sierpinski triangle.  In this piece (and the others submitted for this assignment), Cissy remarked that she really enjoyed experimenting with color.  I commented that I thought color choices were among the most difficult decisions to make as far as elements of a work of digital art are concerned.

Day115Cissy1.png

The second piece was to involve only two affine transformations.  This is often a challenge for students, but there really is an enormous variety of images that may be created using just two transformations.  In addition, one of the transformations needed to involve a rotation by a non-trivial angle (that is, not a multiple of 45°), and students needed to submit a picture of their calculations as well.

One student was trying to create an image that looked like an animal footprint.  She remarked that she did consider a different color palette, but in the end, preferred to go with monochromaticity.
Day115L2.png

Interestingly, Terry also used a simple color palette.  She remarked that it was challenge to use just two transformations — and because of this minimalist requirement, decided to go with a minimalist color palette.  In addition, her resulting fractal reminded her of birds, so she set the fractal against a white moon and gray sky.

Day115Terry2

For the third submission, there were no constraints whatsoever — in fact, I encouraged students to be as creative as possible.  There was a very wide range of submissions.  One student was fairly minimalistic, using a highly contrasting color palette.

Day115A

Jack’s piece was also fairly minimalistic.  I should remark that we took part of a lab one day for students to do some online peer commenting; Jack (and others as well) remarked that he used the advice of another student to improve an earlier draft of his piece.  In particular, he adjusted the stroke weight to increase the intensity of the colors.

Day115Jack.png

Tera based her work on the Sierpinski triangle,  but also included reflections of each of the three smaller components of her version of the Sierpinski triangle.  She remarked that the final image reminded her of a snowflake, or perhaps a Christmas sweater.

Day115Tera.png

Alex’s inspiration came from The Great Wave off Kanagawa, by Katsushika Hokusai.

The_Great_Wave_of_Kanagawa.jpg
Courtesy the Wikipedia Commons.


First, he created the fractal image, experimenting with various color combinations.  When he was satisfied with his palette, he added the boat and the white circle to suggest a black moon.  A rather interesting approach!

Day115Alex.png

As you can see, I’ve got quite a creative class of students who are willing to experiment in many different ways.  It’s interesting for me, since there is no way to predict what they’ll create next!  I look forward to seeing what they create when they really dive deeply into Processing and begin making animations.

In the next update, I’ll report on how students involve Processing in their project proposals.  In addition, they will have submitted their fractal movie projects by then, so there will undoubtedly be many interesting examples of student work to exhibit.  Stay tuned!

Mathematics and Digital Art: Update 1 (Fall 2017)

About a month has passed since beginning my third semester of Mathematics and Digital Art!  As with last semester, I plan on giving updates about once a month to discuss changes in the course and to showcase student work.

The main difference this semester (as I discussed a few weeks ago) was starting with Processing right from the beginning.  From my perspective, the course has run more smoothly than ever — and some of my students are already really getting into the coding aspect of creating digital art.

I do believe that beginning this way will pay off when we get to making movies.  Since we’ll already know the basics and understand the difference between user space and screen space, I can focus more on the interactive abilities of Processing — such as having features of the displayed image change by moving the mouse or pressing different keys on the keyboard.

The first two assignments were essentially the same as last semester.  We began with discussing color and the work of Josef Albers, emphasizing the fact that there is no such thing as “pure color” — colors are only perceived in relation to other colors.

Again, I was surprised by the diversity of the images students created.  Like last year, a few students experimented with a minimalist approach.  Here is what Alex generated using just a 2-by-2 grid of squares.

Day112Alex

I should point out that outlining the geometrical objects (using the strokeWeight function) is not “pure” Albers — you aren’t really seeing one color on top of another due to the black outlines.  But I did have students submit three pieces, insisting that one of the pieces was created only by changing the parameters in the original Albers routine, as shown in the following submission.

Day112Linh2

Here is Courtney’s submission on this theme, again created only by changing parameters to the drawing routine.

Day112Courtney


Most students — I think in part due to the fact that we started discussing code even earlier than previous semesters — really pushed the geometry far beyond the simple idea of rectangles within rectangles.

While toying with various geometrical motifs, Tera found something that reminded her of a rose.  This influenced her color palette:  reds and pinks for the flowers, with a green background, meant to suggest that the flowers were in a garden.

Day112Tera

Cissy explored the geometry as well.  Note how keeping the stroke weight at zero — so that the geometrical objects have no outline — creates a more subtle effect, especially since the randomness from the dominant color is not too pronounced.

Day112Cissy

The second art assignment, as in the previous semesters, was to explore creating textures using randomness in both color and shape.  As with the first assignment, I wanted students to submit one piece which involved only changing the parameters to a given function.  In this case, the function created a grid of gray circles, with both the intensity of the gray and the size of the circles having some degree of randomness.  I think it is important that students do some work within given constraints — it really challenges their creativity.  Here is Terry’s piece along these lines.

Day112Terry


The second piece was based on a function which created a grid of squares of the same size, but random colors.  Here, there were no constraints — students could modify the geometry in any way they wanted to.  Several were quite creative.  For example, Sepid approached this task by choosing both shape and color to create an image reminiscent of a stained glass window.

Day112Sepid

The third piece involved a color gradient (see my previous posts on Evaporation).  If you look back at these posts, you’ll recall that a color gradient can be created by increasing the randomness of the colors as you move from the top of the image to the bottom using a power function:  f(y)=y corresponds to a linear gradient, f(y)=y^2 corresponds to a quadratic gradient, etc.  Different effects can be created by varying the exponent.
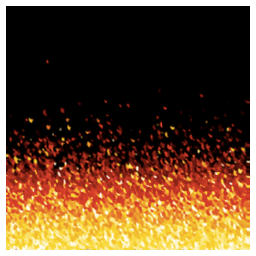
As I was discussing this in class, one student asked what would happen if you used a negative exponent.  I had never thought about this before!  Jack used this idea in his piece, which he said reminds him of looking at a fire.

Day112Jack

It turns out that using a negative exponent creates a gradient beginning with black on the top.  Why is this?  As the image proceeds lower down the screen, the algorithm subtracts values from the RGB parameters proportional to y^n, where y=0 corresponds to the top of the image, and y=1 corresponds to the bottom of the image.

So if the exponent n is positive, there is very little randomness subtracted.  But if the exponent is negative, a lot of randomness is subtracted, since now the numbers near 0 are on the denominator.  Because the RGB values only go up to 255, subtracting a large degree of randomness leaves nothing left — in other words, black.  Now some of the numbers will end up being negative  near the top– but putting all negative numbers in a color specification in Processing does in fact give you black.

Another student also worked with yellows and reds to imitate fire in another way.  Instead of making small circles, he made larger circles with quite a bit of overlap, creating a rather different effect.

Day112Ali.png

And Rosalie found in interesting say to create stripes with the algorithm.  I had not seen this effect before.

Day112Rosalie

So that’s it for the first update of the Fall 2017 installment of Mathematics and Digital Art.  As you can see, my students are already being quite creative.  I look forward to seeing their work develop as the semester progresses!


To Processing I

I made a decision last week to abandon using Sage (now called CoCalc) as a platform in my Mathematics and Digital Art class.  It was not an easy decision to make, as there are some nice features (which I’ll get to in a moment).  But now any effective use of Sage comes with a cost — the free version uses servers, and you are given this pleasant message:  “This project runs on a free server (which may be unavailable during peak hours)….”

This means that to guarantee access to CoCalc, you need a subscription.  It would not be prohibitively expensive for my class — but as I am committed to being open source, I am reluctant to continue putting sample code on my web page which requires a cost in order to use.  Yes, there is the free version — as long as the server is available….

When I asked my students last semester about moving exclusively to Processing, they responded with comments to the effect that using Sage was a gentle introduction to coding, and that I should stick with it.  I fully intended to do this, and got started preparing for the first few days of classes.  I opened my Sage worksheet, and waited for it to load.  And waited….

That’s when I began thinking — I did have experiences last year where the class virtually came to a halt because Sage was too slow.  It’s a problem I no longer wanted to have.

So now I’m going to Processing right from the beginning.  But why was I reluctant in the past?

The issue is that of user space versus screen space.  (See Making Movies with Processing I for a discussion of these concepts.)  With Sage, students could work in user space — the usual Cartesian coordinate system.  And the programming was particularly easy, since to create geometrical objects, all you needed to do was specify the vertices of a polygon.

I felt this issue was important.  Recall the success I felt students achieved by being able to alter the geometry of the rectangles in the assignment about Josef Albers and color.  (See the post on Josef Albers and Interaction of Color for a refresher on the Albers assignment.)

peyton
Peyton’s piece on Josef Albers.

Most students experimented significantly with the geometry, so I wanted to make that feature readily accessible.  It was easy in Sage, the essential code looking something like this:

Screen Shot 2017-08-26 at 11.08.35 AM

What is happening here is that the base piece is essentially an array of rectangles within unit squares, with lower-left corners of the squares at coordinates (i, j).  So it was easy for students to alter the polygons rendered by using graph paper to sketch some other polygon, approximate its coordinates, and then enter these coordinates into the nested loops.

Then Sage rendered whatever image you created on the screen, automatically sizing the image for you.

But here is the problem:  Processing doesn’t render images this way.  When you specify a polygon, the coordinates must be in screen space, whose units are pixels.  The pedagogical issue is this:  jumping into screen space right at the beginning of the semester, when we’re just learning about colors and hex codes, is just too big a leap.  I want the first assignment to focus on getting used to coding and thinking about color, not changing coordinate systems.

Moreover, creating polygons in Processing involves methods — object-oriented programming.  Another leap for students brand new to coding.

The solution?  I had to create a function in Processing which essentially mimicked the “polygon” function used in Sage.  In addition, I wanted to make the editing process easy for my students, since they needed to input more information this time.

Day108pyde1

In Processing — in addition to the number or rows and columns — students must specify the screen size and the length of the sides of the squares, both in pixels.  The margins — xoffset and yoffset — are automatically calculated.

Here is the structure of the revised nested for loops:

Day108pyde2

Of course there are many more function calls in the loops — stroke weights, additional fill colors and polygons, etc.  But it looks very similar to the loop formerly written in Sage — even a bit simpler, since I moved the translations to arguments (instead of needing to include them in each vertex coordinate) and moved all the output routines to the “myshape” function.

Again, the reason for this is that creating arbitrary shapes involves object-oriented concepts.  See this Processing documentation page for more details.

Here is what the myshape function looks like:

Day108pyde3

The structure is not complicated.  Start by invoking “createShape,” and then use the “beginShape” method.  Adding vertices to a shape involves using the “vertex” method, once for each vertex.  This seems a bit cumbersome to me; I am new to using shapes in Processing, so I’m hoping to learn more.  I had been able to get by with just creating points, lines, rectangles, and circles so far — but that doesn’t give students as much room to be creative as including arbitrary shapes does.

I should point out that shapes can have subshapes (children) and other various attributes.  There is also a “fill” method for shapes, but I have students use the fill function call in the for loop to avoid having too many arguments to myshape.  I also think it helps in understanding the logical structure of Processing — the order in which functions calls are invoked matters.  So you first set your fill color, then when you specify the vertices of your polygon, the most recently defined fill color is used.  That subtlety would get lost if I absorbed the fill into the myshape function.

As in previous semesters, I’ll let you know how it goes!  Like last semester, I’ll give updates approximately monthly, since the content was specified in detail in the first semester of the course (see Section L. of 100 Posts! for a complete listing of posts about the Mathematics and Digital Art course).

Throughout the semester, I’ll be continuously moving code from Sage to Processing.  It might not always warrant a post, but if I come across something interesting, I’ll certainly let you know!

Mathematics and Digital Art: Final Update

It’s hard to believe yet another academic year is over!  I do think this second semester of Mathematics and Digital Art went a little more smoothly than the first.  This shouldn’t be too surprising, though — the first time implementing any new course is a little bumpy.  Though I must admit, there were surprisingly few bumps the first time around….

Like last semester, I had students create a movie in Processing.  The main tool I had them use was linear interpolation to create animation effects.  As before, I encouraged them to use linear interpolation with any numerical parameter in their movie — how much red there is in the background color, the position of objects on the screen, or the width of points and lines, just to name a few possibilities.

Colette created some interesting visual effects.  Some students (like her) took advantage of the fact that if you don’t set the background color in the draw function in Processing, successive calls to the draw function overlap the previous ones, giving a sense of movement.


Peyton was inspired when her friends invited her to go to the beach.  Here is a screen shot of her movie, where the moon reflects off the rippling waves of the sea at Ocean Beach in San Francisco.

PeytonMovie

Next, I’d like to share a few pieces from students’ Final Projects.  Recall that Final Projects are an important part of the course — during the second half of the semester, we spend one or two days a week working on them.  This is the opportunity for students to explore any aspect of the course in more detail.

While Lainey focused on making images which reminded her of her dreams, she began with this collage including  several motifs from our coursework throughout the semester.  She was one of the few to incorporate L-systems into her Final Project.

FinalPresentation-ElaineTousignant


Karina, as many students did, experimented with image processing.  She wanted to overlay multiple images at various transparencies to create a kaleidoscopic effect.  Rotating the images required that she brush up on her trigonometry….

Karina


Karla was interested in experimenting with color.  She was interested in morphing images of the Buddha.  Karla used the RGB values of the pixels in an original image, like the one shown below on the left, to determine the RGB values of the pointillistic image shown on the right.

KarlaFinal

Also like last semester, I asked students to write a final response paper about their experience with the digital course.  The responses were similar to those of last semester, so I’ll only include a few excerpts here.

I think differently about mathematics in how it relates to art. I always thought that the two would be separate entities, but this class has proved that’s not always the case.

After having taken this course this semester I really have gained an interest in art and programming that I certainly didn’t have before, even after having taken some courses in programming. I think that actually being able to see the endless things that are able to be created using programming and math is really cool….

One student made a particularly interesting remark:

I wish that I had more knowledge on how to type my own code. There were points in the semester where the art I was creating felt a bit like a coloring page where we were given a page that was already drawn and told to fill it in and try to make it our own.

Of course this is what I want to read!  I do want to inspire students to investigate programming further — but students taking this course receive a mathematics credit.  There is certainly no doubt in your mind about how passionate I am about having students learn to write code, but I do need to emphasize the mathematics of digital art.  Maybe next semester I’ll have Nick run some extra sessions on coding for those who are interested in learning more.

I also wanted to share some work from the other course I taught this semester, Linear Algebra and Probability.  I have students work with affine transformations and iterated function systems in this course as well.  Their first project is a still image using Sage, and their second project is a fractal animation using Processing.  Here is Jay’s submission.


And finally, I want to remind you that Mathematics and Digital Art is becoming a university-wide course next year.  I am working with the Fine Arts department here at USF to encourage incoming fine arts majors to earn their mathematics credit by creating digital art!  I expect the course to be quite a bit larger this Fall, and will be connecting with the Fine Arts faculty to make sure the content meets their needs as well.

In addition, I will be giving a talk at Bridges this summer (in Waterloo, (the Canadian one, that is)) about my digital art course.  I’m expecting that I’ll receive a wide range of comments and suggestions, so the course may be a little different in the fall.  That’s one nice feature of this course — it’s not a prerequisite for any other course, so there is some flexibility as far as content is concerned.

Like this semester, I’ll provide monthly updates to let you know what changes I’ve implemented, and also to showcase student work.  So stay tuned!

Mathematics and Digital Art: Update 3

It’s hard to believe it’s been a month since my last update!  This semester has been unusually busy.

At the end of my last update, I said I’d talk more about using L-systems in class.  I decided to focus on the symmetrical Koch-like images I had been working on for the past few years.  There are two reasons for this.  First, it’s fresh — and demonstrates that creating new fractal images is an active research topic; not everything is known.  Second, you need to know some elementary number theory in order to create symmetrical images.  Since none of the mathematics we studied so far was closely related to number theory, this was a great opportunity to see yet another application of a different branch of mathematics.

Day007koch-45-175

I started with introducing the basics of modular arithmetic.  This was new to most students, but the motivation was easy:  the direction you’re pointing after any given move is relevant to deciding if your sequence of segments closes up.  And any time you turn counterclockwise, you increment the direction by the angle you turn, but subtract 360° when you go over 360° since a turn of 360° doesn’t alter your direction.  This is just using a modulus of 360 for the direction you’re pointing.

Then, I reminded them how to find the prime factorization of numbers in order to create a 2-adic valuation.  Recall that the 2-adic valuation of a number is the exponent of the highest power of 2 which divides that number.  This is significant since the 2-adic valuation (mod 2) indicates how to turn when drawing a Koch-like curve:  a 0 represents one angle (60° for the Koch curve), and a 1 represents the other (240° for the Koch curve).  So we created charts like this:

Day0902adic

Then finally, I showed students how to find angle pairs which created symmetrical images using a theorem in a paper I’m working on for the College Mathematics Journal.  As the proof involves significantly more mathematics at a level beyond what we could reasonably discuss in the course, I just showed them the result.  I won’t go into details here, but I’d be glad to share a draft of the paper if you’re interested and adventurous….

For their project work, they had to create images using the results of the theorem in Processing.  Karla created this image, which I find interesting since it exhibits six-fold symmetry, but the exterior elements have seven points on them.  So rarely do you encounter 6 and 7 together in geometry.

Day090karla

Peyton created this image, which is suggestive of a complete image, but which doesn’t include all the line segments.  But the overall symmetry of the image is clear; you can complete it in your mind’s eye.

Day090Peyton

I also asked students to create an image which did not close up, to experiment with parameters which generated a more chaotic image.  Colette created this image, which reminded her of the top of a pine tree.

Day090Colette

Some students did have difficulty using the theorem correctly to generate images with symmetry, so next semester I’ll spend a little extra time making sure everyone’s on track.

We also had another guest speaker visit the class since the last update.  I met Gwen Fisher at the Art Exhibition in Santa Clara at the Regional MAA meeting last month, and thought she would be a great fit for our class.  What I liked about her art is that she works with beads in very mathematical ways — and her work is very different from anything we had been doing in the class.

She brought in several of examples of her beadwork to pass around.  You can see many beautiful pieces on her website, including this Wisdom Mandala piece she designed.

Day090Gwen
Wisdom Mandala, by Gwen Fisher.

What was wonderful about her presentation was that Gwen discussed both the design and the execution of her pieces.  My students were very engaged, and asked lots of questions along the way.

It turns out, though, that I had seen a talk she gave two or three years ago at another conference!  Of course you can’t remember every speaker you see at every conference you attend, especially out of context.  But after seeing her talk, I realized some of the slides looked strangely familiar, and that is because I had actually seen them before….

One more bit of news.  You might remember that Mathematics and Digital Art has been offered as a First-Year Seminar course this year, meaning that only first-year students may enroll, and the maximum number of students in the course is set at 16.

Being a faculty member at the University of San Francisco, I am also working on a project with colleagues in creating a Mathematics for Educators minor — a series of courses aimed at prospective middle-school teachers to broaden their knowledge of mathematics especially suited to middle-school students.  And of course a digital art course would fit nicely into this framework.

But what if a student decides to opt for the minor after their first year?  Well, they couldn’t take digital art.  So now, the course is a regular offering in the Mathematics and Statistics Department, open to any student at USF.  I’m very excited about this, and really hope to spread the word about the Imagifractalous world of mathematics and digital art!

I’ll keep you updated in the Fall, as I have more changes in store for the course.  I plan to move completely to Processing, since now everything I used Sage for has been rewritten for Processing.  And next semester, I’ll include a short unit on binary trees as well.  Stay tuned….

Mathematics and Digital Art: Update 2

It’s been about a month since my first update, so it’s time for another status report on my second semester teaching Mathematics and Digital Art.  It really has been a wonderful semester so far!

Later we’ll look at some student work (like Collette’s iterated function system),

IFSCollette

but first, I’d like to talk about course content.

The main difference from last semester in terms of topics covered was including a unit on L-systems instead of polyhedra.  You might recall the reasons for this:  first, students didn’t really see a connection between the polyhedra unit and the rest of the course, and second, the little bit of exposure to L-systems (by way of project work) was well-received.

Day007koch1

I’ve talked a lot about L-systems on my blog, but as a brief refresher, here is the prototypical L-system, the Koch curve.  The scheme is to recursively follow the sequence of turtle graphics instructions

F  +60  F  +240  F  +60  F.

There is also an excellent pdf available online, The Algorithmic Beauty of Plants.  This is where I first learned about L-systems.  It is a beautifully illustrated book, and I am fortunate enough to own a physical copy which I bought several years ago.

Talking about L-systems is also a great way to introduce Processing, since I have routines for creating L-systems written in Python.  Up to this point, we’ve just explored changing parameters in the usual algorithm, but there will a deeper investigation later.

One main focus, however, was just seeing the fractal produced by the algorithm.  When working in the Sage environment, the system automatically produced a graphic with axes labeled, enabling you to see what fractal image you created.

In Processing, though, you need to specify your screen space ahead of time.  So if your image is drawn off-screen, well, you just won’t see it.  You have to do your own scaling and translating, which is sometimes not a trivial undertaking.

I also decided to introduce both finite and infinite geometric series in conjunction with L-systems.  This had two main applications.

First, we looked at the Sierpinski triangle.  Begin with any triangle, and take out the triangle formed by joining the midpoints of the sides.  Then repeat recursively, creating the Sierpinski triangle.

Sierp3

Now assume your original triangle had an area of 1, and calculate the area of all the triangles you removed.  Since the process is repeated infinitely, this sum is just an infinite geometric series.  Interestingly, the sum of this series is 1, meaning, in some sense, you’ve taken away all the area — but the Sierpinski triangle is still left over!  This illustrates an idea not usually encountered by students before:  infinite sets of points with no area.  Makes for a nice discussion.

Second, we looked at the Koch curve (and similarly defined curves).  Using a geometric sequence, you can look at the length of any iteration of the polygonal path drawn by the recursive algorithm.  And, as expected, these paths get longer each time, and their lengths tend to infinity as the number of iterations increases.  This is another nice way to involve geometric sequences and series.

We’ll be doing more with L-systems in the next few weeks, so I’ll finish this discussion on my next update.

A highlight of the past month was a visit by artist Stacy Speyer.

004 I'llNeverKnow
I’ll Never Know, by Stacy Speyer.

Having worked with weaving and textiles for some time, Stacy has moved on to an investigation of polyhedral forms.

075-WovenGeoInstallVert

Stacy’s talk provided a wonderful insight into integrating mathematics and art in ways we did not study in class.  One of the goals of the Bridges papers presentations and the guest speakers is to do precisely this

She writes:

I’m now on a mission to share the fun of making geometric forms with others; I designed Cubes and Things, a 3D coloring book.  These easy-to-make paper constructions have patterns that can be colored which emphasize different kinds of symmetric properties of the polyhedra.  I bring this fun activity to schools and other groups in the form of Polyhedra Parties.  And whenever possible, I still work on making more geometric art and learning more about math.

Visit Stacy’s website to take a look at her book, and view many more examples of her stunning work!

Now we’ll take a look at a few more examples of student artwork.  These pieces were submitted for the assignment on iterated function systems.  Karla created a piece which reminded her of icicles or twinkling lights.

IFSKarla

Lainey thought her piece looked like a bolt lightning coming out of a wizard’s staff.

IFSLainey

And Peyton’s piece reminder her of flowers.

IFSPeyton

Finally, as I did last semester, I asked students for some mid-semester comments on how the course was going.  You can see the complete prompt on Day 19 of the course website.  Here are a few of the comments:

I like how it takes a subject that we are all required to take and creates a real, palpable output. Rather than some types of math, where everything is theoretical, it creates a clear chain of events with an even clearer consequence.

[A]fter seeing the kinds of art works there are that involve the kind of math and programming we use, it opened up a new world of artistic possibilities.

What I enjoy most about this course aside from it being small and very interactive in terms of doing labs and having all of our questions answered, is the fact that I would never thought I would be able to create images using programming or math let alone enjoying the satisfaction of the final product.

I was pleased to read these responses, as they suggest the course is fulfilling its intended purpose.  But there were also suggestions for improvement — there was a consensus that the math moved a bit too quickly.  When we start the discussion on number theory for analyzing the Koch curve next week, I’ll make sure to keep an eye on the pace.  I’ll let you know how it goes in my next update in April!

Mathematics and Digital Art: Update 1

I have the pleasure of teaching Mathematics and Digital Art again this semester!  Since I’m largely following my outline from last semester, biweekly reports aren’t really necessary.  But every month or so, I’d like to provide an update regarding changes I’ve made from the previous semester, as well as provide examples of student work.

There are no significant content changes yet — although I’ll be discussing L-systems rather than polyhedra this semester, and there will be more to say when we get to that point.  But as far as the delivery is concerned, there have been some alterations.

First, I’m emphasizing the code more right from the start.  You might recall that in their mid-semester comments last semester, students asked for more details about the actual coding.  So I take more time in each lab explaining Python.

This change has already made an impact; I’ve noticed that students are getting more adventurous with coding earlier on.  They really seem to enjoy experimenting with the geometry.  The example I use for the Josef Albers assignment looks like this — just rectangles within rectangles.

sample

But Collette took the geometry quite a few steps further.  In her narrative, she discussed working with figure and ground, trying to make each geometrically interesting.

Collette.png

I am pleased to see students playing so intently with the geometry.  At first, after a detailed discussion of using two-dimensional coordinates in Python, some students just tried randomly changing numbers to see what would happen.  But I encouraged them to be a little more intentional — that is, spend more time in the design stage — and they were largely successful.

The second change is that I spent an extra day on affine transformations at the beginning of our discussion, slowing down the pace a little.  Last semester, I recall that I needed to go back and review ideas I thought I covered in sufficient detail.  Hopefully, slowing down the pace will help.

In addition, I put together a summary of commonly used affine transformations, such as reflections:
guide

This seemed to be helpful — I used it for the linear algebra course I’m teaching as well, and students responded positively.  Feel free to look at it; just go to Day 6 on the course website.

The third change involves using discussion boards more deliberately on Canvas (which is our University’s content management system).  For each digital art assignment, I have students post drafts of their work, and have their peers comment on them.  Since I have a small class this semester (six students), it is not a problem to have each student comment on every other student’s work.

Students really seem to enjoy this, and I participate by writing comments as well.  But because everyone works at a different pace, some students lagged behind.  So now I’m being more formal about using the discussion board, and making it an assignment.

For example, the next assignment involves creating three pieces, and I have assigned students to upload drafts on Canvas by the beginning of class next Friday.  We’ll use Friday’s class so students can write and read comments; the assignment isn’t due until a few days later, so there will be time to incorporate new ideas into their drafts.

These changes are making a positive impact, and are making the course even more enjoyable this semester.  And I am also fortunate to have Nick Mendler as my course assistant again this semester, meaning there are two of us to work with students each day.  Students are really getting individual attention with their work.

Now let’s look at some more examples of student work!  For the assignment to create a color texture using randomness, Lainey worked to create an image which resembled a piece of fabric.

Lainey.png

For the Josef Albers assignment, Peyton (like Collette) also experimented a lot with the geometry of the individual elements.  She chose a color palette which reminded her of a succulent, and so created geometrical objects which represented spikes on a plant.

Peyton.png

And for the assignment based on my Evaporation piece, Karla chose a pink palette.  She looked at various values for the radius and the randomness in the radius so as to create a balance between overlapping circles and white space between the circles.

karla

Stay tuned for the next update!  In the next installment, I’ll let you know how the work with L-systems went.  One of my favorite topics…..

Digital Art VIII: The End.

Yes, Mathematics and Digital Art is officially over.  Personally, this has been one of the most enjoyable courses I’ve taught, but also one of the more challenging.  From the initial course proposal — begun in November 2015! — to the Final Projects, it seems there was always something unexpected popping up.  But in a good way, since these surprises often involved such things as writing code for a student’s project, or helping a student incorporate a creative aspect into a digital artwork which I had not previously considered.

As I mentioned last week, the last assignment was to write a final Response Paper about the course.  Students had many good things to say, but also made some suggestions for improvement.

I feel like now, though, especially through the talks we were given from other artists, that my scope of the word “art” has broadened. The realm of digital art is so much wider than I could have imagined and includes a lot more mediums than I would have thought.

After completing this course, I realize that the world of art is even vaster, with so many areas still left unexplored or underexplored.

Wow!  I was so glad to see how the course broadened students’ perspectives.  Some students also mentioned the presentations on Bridges papers in this regard — how they were able to learn about many diverse topics in a brief amount of time.  They got a small taste of what it’s like to go to a Bridges conference….

As I had hoped, many students’ perspectives on mathematics changed during the course.  I’ll let the students speak for themselves.

Overall, I really enjoyed the class. Through high school, math was complicated and boring, but this class made me appreciate math in a different way, and I enjoyed learning about coding and digital art.

After this course, I definitely think about math differently, because now I know how it can be used to figure out shapes and layers and colors that I can use in my art. I also think differently about art, because before this course, I had only really done traditional art, and had no idea about any digital art besides using a tablet to draw with instead of a pencil. This course has really opened my mind to what I think art can be, and definitely how it can be created in different ways.

As with most classes, I learned a lot of significant things, but this class really taught me how to push beyond my boundaries and comfort zones. Learning about fractals and affine transformations were mathematically the most difficult part for me, but without those chapters I probably wouldn’t have sharpened my basic math skills….

I felt the coding part of the course was pitched at about the right level.

I soon realized that even though I had no background in code the material was explained and taught so that anyone could understand it.

But some  students commented that they would like to go into more depth as far as programming is concerned.

And one student even decided to minor in computer science!

Best of all, this class is part of the reason why I decided to declare a minor in computer science. It is something I have been considering as I have always had an interest in the subject, but I feel this class had really helped fuel that interest and give me the final nudge I needed.

Most students remarked about how much they loved learning to make movies in Processing, and how the small class size really helped them in terms of their personal learning experience.  The class was just nine students, and I had Nick to help me out — so I felt I really got to know the students.  Not a luxury I’ll always have….

Aside from focusing more on code, some students commented on how we didn’t really use the few weeks on polyhedra anywhere else in the course.  Yes, I wanted to give them some exposure to three-dimensional geometry without having to spend the time developing the mathematics of a three-dimensional Cartesian coordinate system.  But it seems this was just too disjointed from the natural flow.

I think a good substitute would be to discuss L-systems for these two weeks instead.  There are two advantages here.  First, L-systems are another really neat way to create fractals, and the class responded very positively when I gave my Bridges talk on L-systems and Koch curves.  And second, this would give a few more weeks when we could discuss coding, especially recursion.  In general, recursion is a difficult topic to teach — but teaching recursion in the context of computer graphics might really help the learning process.

I also asked Nick if he’d say a few words about his experience with the course.

I was very excited to work with Professor Matsko on Math and Digital Art, I think we both caught on a while back that the great flexibility I’ve found within the math department to support creative interests can be shared with other students. Also the instant gratification that we were finding from programming was really picking up. When communication from generated images was profoundly more efficient than any attempt to explain with words, it was clear that we had to invite more people to the conversation.

What I think has been so powerful following my discovery of programming – and what I hope I left with the students – is the ability to paste mathematical notation for very specific thoughts directly into the computer so that I can just look at what those thoughts literally mean. This continues to be the best way that I’ve found to meet and greet interesting new patterns and behaviors. Ultimately I think this is extremely natural and that the students caught on quite well: curious how a fractal might react? Poke it and find out!

Some areas definitely saw unexpected challenges, but once we got their mathematical comfort zones lined up with the curriculum the enthusiasm was excellent. My favorite part was definitely helping students let their imaginations fill the newly available parameter space. It was really great that we had a small class size, too – the two of us walking around made the perfect environment for any question to be asked during open days when they worked on self-directed projects. And it really felt like success to observe students becoming fixed on a single idea of what they wanted to create, whether or not they knew anything about how they would create it.

Overall I may have learned more than the students and was very surprised by the deeper understanding that begins to build after explaining to the masses. I would be very interested in assisting a course again!

As long as enough students enroll, I’ll be teaching Mathematics and Digital Art again next semester!  I won’t be reporting as frequently as I did this first semester, but expect updates every month or so….  Who knows what creative ideas next semester’s students will come up with?

Digital Art VII: Final Projects!

It’s hard to believe that the semester has finally come to an end!  And I must say that Mathematics and Digital Art was one of most enjoyable courses I’ve ever taught.  I’ll summarize my thoughts in a later reflective post, but today I’d like to showcase my students’ Final Projects.  There really was some exceptional work — but I’ll let the images speak for themselves.

Many students built upon the work we did earlier in the semester. Safina used several different elements we explored during the course.  In addition, she researched turtle graphics in Python to incorporate additional elements (those with lines emanating from a central point).

SM-MathProjectFinal.png


A few students especially enjoyed the work we did with color and Josef Albers, and created projects around different ways to contrast colors.  Andrew created many variations on a triangular theme.

screen-shot-2016-11-20-at-7-02-02-pm

He took this idea further, and went so far as to combine different triangles in composite images.

Hexagon-01.png

Julia, on the other hand, experimented with other geometrical objects.  She played with having colors interact with each other, and created the following image.  Although it may not look like it, the two center circles are in fact exactly the same color!

jn-capture7

Two students were interested in image processing, and worked closely with Nick to learn how to use the appropriate Python libraries in order to work with uploaded images.  Madison’s work focused on sampling pixels in an image and replacing them with larger circles to create an impressionistic effect.  She found that using a gray background gave the best results.

MJ-Screen Shot 2016-11-30 at 9.51.23 PM.png


Lucas also worked with image processing.  He began by choosing a fairly limited color palette.  Then for each pixel in his image, he found the color on his palette “nearest” the color of that pixel (using the usual Euclidean distance on the RGB values), and then adjusted the brightness.  The image below is one example illustrating this approach.

LA-Screen Shot 2016-12-04 at 11.42.53 PM.png


Two students worked with textures we experimented with earlier in the semester to create pieces like Evaporation.  Maddie wanted to recreate a skyline of Dubai (photo from the Creative Commons).

mc-dubaiskyline

She picked out particular elements to emphasize in her work.  You can clearly see the tall buildings and lit windows in a screenshot of her movie.

MC-Screen Shot 2016-12-02 at 9.26.26 AM.png


Sharon was interested in working with some of Dali’s paintings, creating impressionistic images by mimicking Dali’s color palette.  Here is her interpretation of The Elephants.

sa-screen-shot-2016-12-11-at-1-28-20-pm

Although we only touched on L-systems briefly in class, Ella wanted to focus on them in her project.  Nick also worked closely with her to create different effects.  Here is a screenshot from one of her movies.

ek-screen-shot-2016-12-11-at-1-33-30-pm

She was able to create some interesting effects by just slightly altering the parameters to L-systems which created trees and superimposing the new L-system on top of the original.  This gave some depth to the trees in her forest.

And one student decided to revisit Iterated Function Systems, but this time using nonlinear transformations in a variety of different ways.  Here is one of her images.

af-screen-shot-2016-12-04-at-7-51-12-pm
So you can see the wide range of projects students undertook!  This typically happens when you give students the freedom to choose their own direction.  I was also inspired by the enthusiasm of some of the students’ presentations.  They really got into their work.

The last assignment was to write a final Response Paper about the course.  The prompt was the same as that for the Response Paper I assigned midway through the course, so I’m curious to see if their attitudes have changed.  I’ll talk about what I learn in next week’s post!