Bay Area Mathematical Artists Seminars, XI

This past weekend marked the eleventh meeting of the Bay Area Mathematical Artists Seminars.  Our host this month was Scott Vorthmann, the mastermind behind vZome.  Scott lives in Saratoga, and so those participants who live in the San Jose area were glad of the short commute.

It seems that the content of our seminars is limited only by the creativity of the artists involved, meaning fairly limitless….  Scott invited anyone interested to come early — 1:00 instead of our usual 3:00 — and be involved in a Zome “build;” that is, the construction of a large and intricate model using Zome tools.  Today’s model?  The omnitruncated 24-cell!

This is not the place to have a lengthy discussion of polytopes in four dimensions.  In a nutshell, the 24-cell is a polytope in four dimensions with 24 octahedral facets.  This polytope is truncated in a particular way (called omintruncation), and then projected into three-dimensional space.

But there is just one problem with the projection Scott wanted to build.  You can’t build it with the standard Zome kit!  No matter.  Scott designed and 3D-printed his own struts — olive, maroon, and lavender.  If you’ve ever played around with ZomeTools, you’ll understand what a remarkable feat of design and engineering this is.

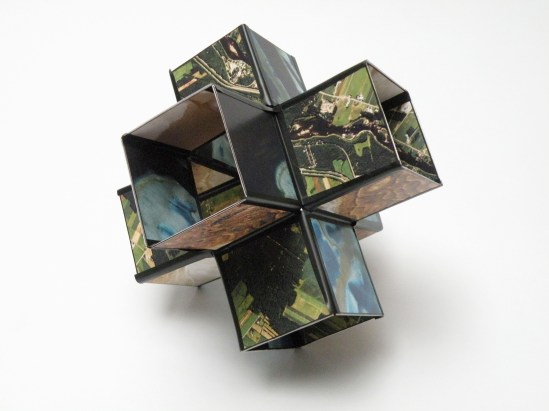
The building process is a modular one — six pieces like the one shown below needed to be built and painstakingly assembled together.

IMAG9535

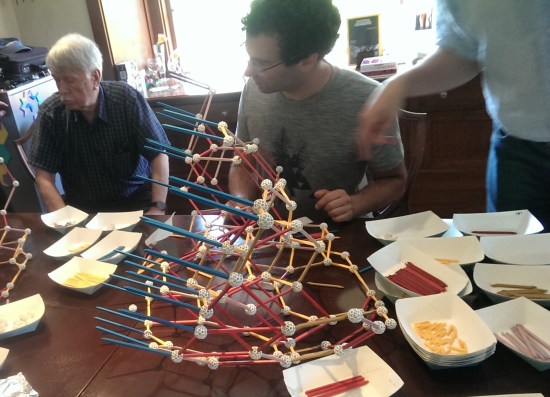
Scott built two of the modules before anyone arrived, so we had something to work from.  That left just four more to complete….

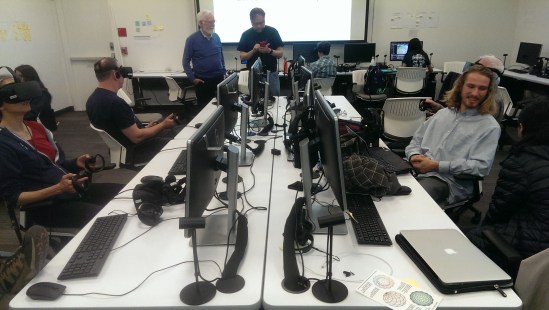
The modules were almost done, but we needed to move on.  In addition to the Zome build, we had two other short presentations.   Andrea and Andy were planning to present a workshop at Bridges 2018 in Stockholm, but at the last minute, were unable to attend.  So they brought their ideas to present to us.

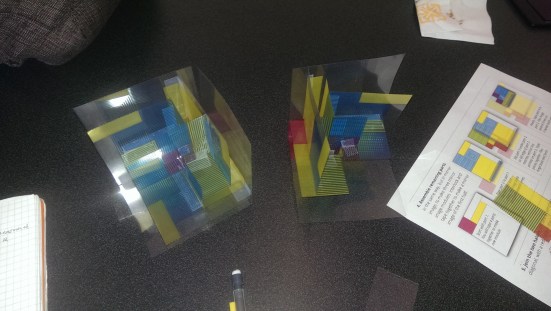
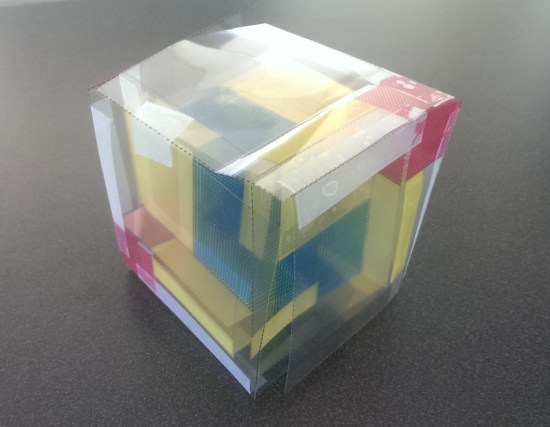
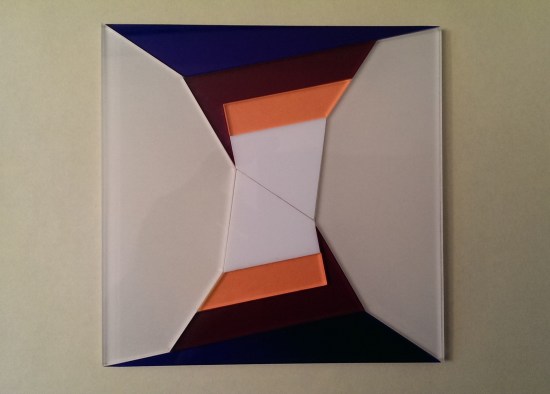
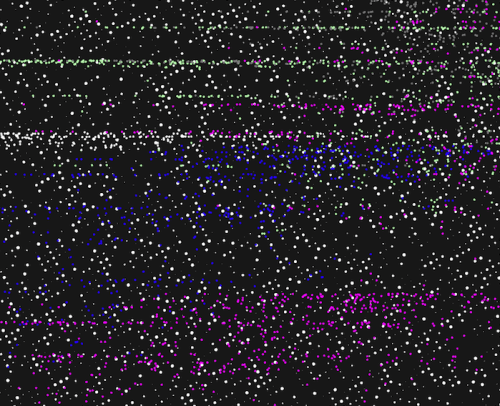
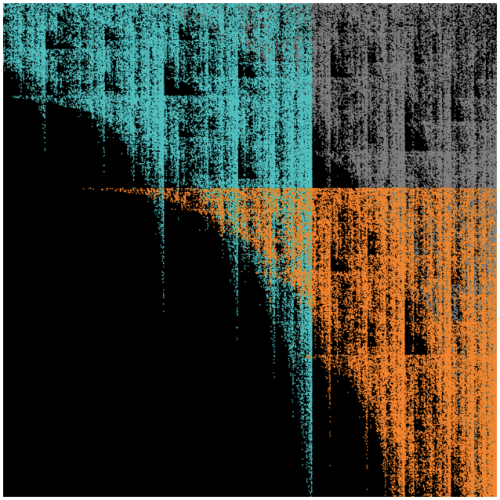
The basic idea is to encode a two-dimensional image using two overlays, as shown here.

Day159crypt1.png

Your friend has an apparently random grid (pad) of black and white squares.  You want to send him a secret message; only you and he have the pad.  So you send him a second grid of black and white squares so that when correctly overlaid on the pad, an image is produced.

This is a great activity for younger students, too, since it can be done with premade templates and graph paper.  And even though Andrea and Andy were not able to attend Bridges, their workshop paper was accepted, and so it is in the Bridges archives.  So if you want to learn more about this method of encryption, you can read all the details about the process in their paper in the Bridges archives.

Our next short presentation was by pianist Hans Boepple, a colleague of Frank Farris at Santa Clara University.  Frank happened to have a very stimulating conversation with Hans about a mathematics/music phenomenon, and thought he might like to present his idea at our meeting.

The idea came from a time when Hans happened to look down a metal cylinder of tubing, like you would find at a hardware store.  It seemed that there was an interesting pattern of reflections along the sides of the tubing, and knowing about music and the overtone series, he wondered if there was any connection with music.

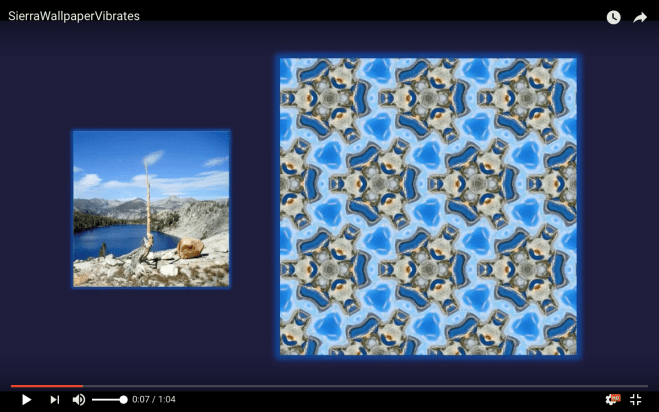
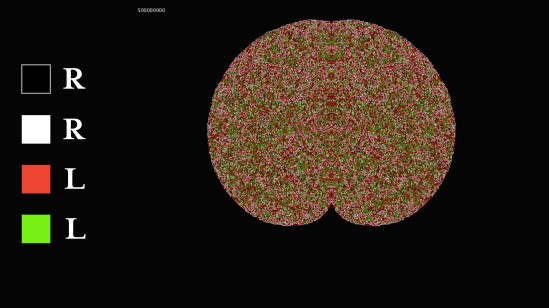
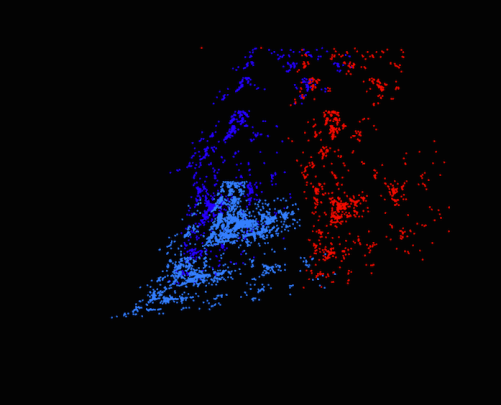
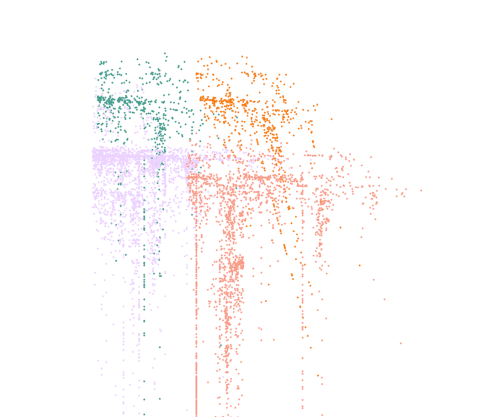
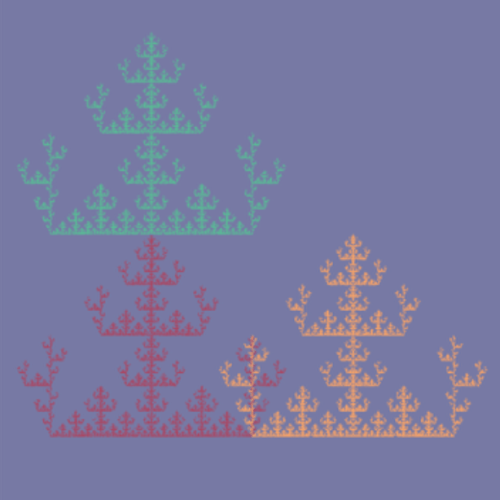
Here is part of a computer-generated image of what Hans produced using paper and pencil many years ago:

IMAG9553

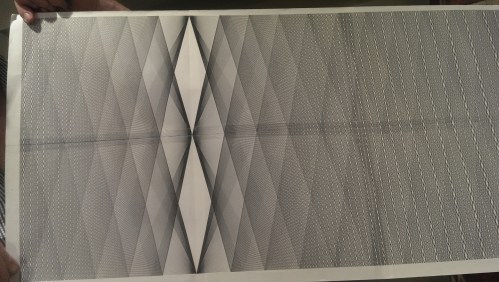
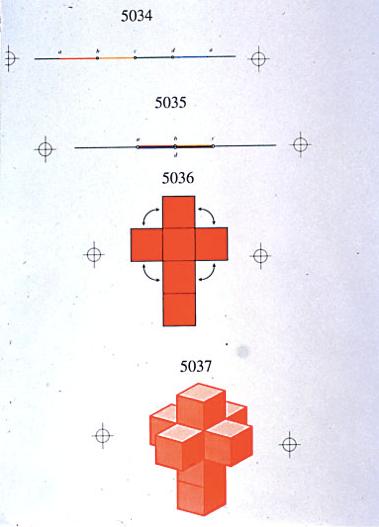
How was this picture generated?  Below is how you’d start making the image.

Day159Hans.png

You can see that the red lines take two zigzags to move from one corner of the rectangle to another, the blue lines take three zigzags, the green four, and the gold lines take five.  If you keep adding more and more lines, you get rather complex and beautiful patterns like the one shown above.  Those familiar with the overtone series will see an immediate connection.

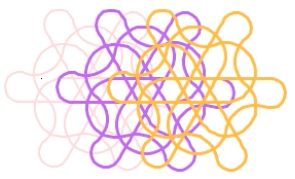
Of course, the mathematical question is about proving various properties of this pattern.  It turns out that the patterns are related to the Ford circles; BAMAS participant Jacob Rus has created an interactive version of this diagram.  Feel free to explore!

In any case, we were delighted that Hans could join us and share his fascination with the relationship between mathematics and music.  You can  learn more about Hans in this interview in The Santa Clara, which is Santa Clara University’s school newspaper.

When Hans finished his presentation, it was time to finish building the omnitruncated 24-cell.  It was quite amazing, as Scott is certainly one of the foremost experts on ZomeTools in the world.  Here is the finished sculpture, suspended from the ceiling in his home.  Just getting the model up there was an engineering feat in its own right!

IMAG9586.jpg

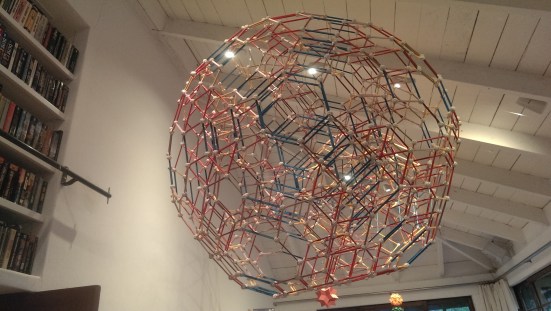
It is difficult to describe the intricacy of this model from just a few pictures.

IMAG9599.jpg

Here is an intriguing perspective of the model, highlighting the parallelism of the blue Zome struts.  It seems there is no end to the geometrical relationships you can find hidden within this model.

And, as usual, the afternoon didn’t end there.  Scott arranged to have Thai food — one of our favorites! — catered in, and we all chipped in our fair share.  We all were having such a great time, the last of us didn’t leave until about 8:30 in the evening.  Another successful seminar!

It is quite heartwarming to see so many so willing to take on hosting our Bay Area Mathematical Artists Seminars.  We have all enjoyed these meetings so much, and we are so glad they continue to happen.  I am confident there will be many, many more delightful Saturday afternoons to experience….

Bay Area Mathematical Artists, VIII

Yesterday was our final meeting of the Bay Area Mathematical Artists for the academic year 2017–2018.  We were back at Santa Clara University to visit their virtual reality lab, the Imaginarium!  It was an amazing visit, coordinated by Frank Farris, Tom Banchoff (who is visiting Santa Clara University this semester), and Imaginarium director Max Sims.

Day144IMAG9147
Sculpture outside the Imaginarium.

While we were waiting for everyone to arrive, Tom generously provided donuts for us to snack on.  But not until we were given a short presentation on a very special property of donuts — the “two-piece” property, which Tom discussed in his doctoral thesis.

A perfectly smooth donut — this is important, since bumps or ridges are problematic — has the property that if you take a knife and make a planar cut, you always get exactly two pieces.

Of course any convex shape automatically has this property.  Donuts, however, are not convex, so they are special in this regard.  Tom remarked that discussing this makes good breakfast conversation, since smooth bagels also have the two-piece property.  But a sufficiently curved banana does not (think of the letter U and make a horizontal cut to get three pieces).

Day144IMAG9148
A different view of the same sculpture.

Once everyone arrived, Tom began with a presentation of his forays into computer graphics and animations.  The first video he showed was made in 1968 with computer scientist Charles Strauss, also at Brown, which showed a torus turning inside out.

What was fascinating was how the video was made.  Keep in mind this was long before platforms like Processing were available….  Even though each frame was black-and-white and consisted of line drawings of a torus in various different configurations, it still took about a minute to create each frame.

Then, each frame had to be photographed — using film, if you remember what that is.  Then another minute, another photograph.  Next, the film was sent on to Boston, where it was processed into a movie.  The movie was sent back — and hopefully, it was just what you wanted….

Fast-forward to 1978, where the subject of the video was rotating cubes and hypercubes. I won’t try to describe it in words, but you can actually see the video online here.

It looks like the graphics in this movie were color graphics!  But no, that wasn’t available yet.  You see color because each frame used four photographs — each taken with a different filter on.  These were overlaid to create a color graphic.  Very creative, and again, certainly much more work than it would take today.  Keep in mind that 1978 was forty years ago….

There were still three movies to go!  Next, Tom showed us his 1985 movie about the hypersphere.  We then got to see Tom’s animation of donut slicing, which was the virtual version of our initial demonstration.  Finally, the last video was from 1999, which was a rotation of the flat torus.

The movies and talk took us halfway through the afternoon.  Now it was time to try on the headsets and have our very own virtual reality experience!

We learned from Max Sims a little about the technical challenges of creating a good VR experience.  First, 90 frames per second is ideal — contrast that with 30 frames per second when creating movies with a platform like Processing.  And second, the response time of the headsets needs to be no longer than 11 milliseconds — that is, when you turn your head to look at something, the image has to change that fast — or else you’ll get motion sickness.

Day144IMAG9139.jpg

The way the lab was set up, everyone got their own computer (although it took me three tries to find one which had everything working properly).  You can see people with headsets on and controls in their hands.

It is very hard to describe what it feels like with the headset on without experiencing it for yourself.  But when you put on the goggles, you’re in a 360-degree visual environment.  That is, when you turn your head to the right, you are seeing what’s to the right of your visual range in the VR simulation.  You can even look down and see what’s underneath you!  It was a little dizzying to look down and see a stream running underneath you, since that meant you were suspended in midair….

The hand controls were different for every experience.  Some allowed you to move things, or select different types of building blocks to make 3D images, or select a different simulation.  It took a bit of getting used to, and I didn’t fully get the hang of it in the hour we had to play around.  But Max said we were welcome back to try out the lab again, and I do intend to take him up on his offer.

After our incredible experience, we went out for Thai — sixteen of us, this time!  We spent over two hours at dinner, which is typical.  These gatherings bring together a diverse group of people interested in all aspects of mathematics and art, and it seems we never run out of things to talk about.

Then the drive home.  I was driving Nick, and we were amazed by the cloud formations we saw all along the way.  Despite my rather dirty windshield, Nick snapped this gorgeous pic.

Day14426146327151007

The clouds were like this for most of the drive home, and were a very fitting end to our last gathering of the semester.

Plans are underway to continue meeting throughout the summer, so stay tuned!

Bay Area Mathematical Artists, VII

We had yet another amazing meeting of the Bay Area Mathematical Artists yesterday!  Just two speakers — but even so, we went a half-hour over our usual 5:00 ending time.

Our first presenter was Stan Isaacs.  There was no real title to his presentation, but he brought another set of puzzles from his vast collection to share.  He was highlighting puzzles created by Wayne Daniel.

Below you’ll see one of the puzzles disassembled.  The craftsmanship is simply remarkable.

Day140Stan1

If you look carefully, you’ll see what’s going on.  The outer pieces make an icosahedron, and when you take those off, a dodecahedron, then a cube…a wooden puzzle of nested Platonic solids!  The pieces all fit together so perfectly.  Stan is looking forward to an exhibition of Wayne’s work at the International Puzzle Party in San Diego later on this year.  For more information, contact Stan at stan@isaacs.com.

Day140Stan2

Our second speaker was Scott Kim (www.scottkim.com), who’s presentation was entitled Motley Dissections.  What is a motley dissection?  The most famous example is the problem of the squared square — that is, dissecting a square with an integer side length into smaller squares with integer side lengths, but with all the squares different sizes.

One property of such a dissection is that no two edges of squares meet exactly corner to corner.  In other words, edges always overlap in some way.

But there are of course many other motley dissections.  For example, below you see a motley dissection of one rectangle into five, one pentagon into eleven, and finally, one hexagon into a triangle, square, pentagon and hexagon.

Day140SK1Look carefully, and you’ll see that no single edge in any of these dissections exactly matches any other.  For these decompositions, Scott has proved they are minimal — so, for example, there is no motley dissection of one pentagon to ten or fewer.  The proofs are not exactly elegant, but they serve their purpose.  He also mentioned that he credits Donald Knuth with the term motley dissection, who used the term in a phone conversation not all that long ago.

Can you cube the cube?  That is, can you take a cube and subdivide it into cubes which are all different?  Scott showed us a simple proof that you can’t.  But, it turns out, you can box the box.  In other words, if the length, width, and height of the larger box and all the smaller boxes may be different, then it is possible to box the box.

Next week, Scott is off to the Gathering 4 Gardner in Atlanta, and will be giving his talk on Motley Dissections there.  He planned an activity where participants actually build a boxed box — and we were his test audience!

Day140Box1.jpg

He created some very elaborate transparencies with detailed instructions for cutting out and assembling.  There were a very few suggestions for improvement, and Scott was happy to know about them — after all, it is rare that something works out perfectly the first time.  So now, his success at G4G in Atlanta is assured….

We were so into creating these boxed boxes, that we happily stayed until 5:30 until we had two boxes completed.

Day140Box2.jpg

I should mention that Scott also discussed something he terms pseudo-duals in two, three, and even four dimensions!  There isn’t room to go into those now, but you can contact him through his website for more information.

As usual, we went out to dinner afterwards — and we gravitated towards our favorite Thai place again.  The dinner conversation was truly exceptional this evening, revolving around an animated conversation between Scott Kim and magician Mark Mitton (www.markmitton.com).

The conversation was concerned with the way we perceive mathematics here in the U.S., and how that influences the educational system.  Simply put, there is a lot to be desired.

One example Scott and Mark mentioned was the National Mathematics Festival (http://www.nationalmathfestival.org).  Tens of thousands of kids and parents have fun doing mathematics.  Then the next week, they go back to their schools and keep learning math the same — usually, unfortunately, boring — way it’s always been learned.

So why does the National Mathematics Festival have to be a one-off event?  It doesn’t!  Scott is actively engaged in a program he’s created where he goes into an elementary school at lunchtime one day a week and let’s kids play with math games and puzzles.

Why this model?  Teachers need no extra prep time, kids don’t need to stay after school, and so everyone can participate with very little needed as far as additional resources are concerned.  He’s hoping to create a package that he can export to any school anywhere where with minimal effort, so that children can be exposed to the joy of mathematics on a regular basis.

Mark was interested in Scott’s model:  consider your Needs (improving the perception of mathematics), be aware of the Forces at play (unenlightened administrators, for example, and many other subtle forces at work, as Mark explained), and then decide upon Actions to take to move the Work (applied, pure, and recreational mathematics) forward.

The bottom line:  we all know about this problem of attitudes toward mathematics and mathematics education, but no one really knows what to do about it.  For Scott, it’s just another puzzle to solve.  There are solutions.  And he is going to find one.

We talked for over two hours about these ideas, and everyone chimed in at one time or another.  Yes, my summary is very brief, I know, but I hope you get the idea of the type of conversation we had.

Stay tuned, since we are planning an upcoming meeting where we focus on Scott’s model and work towards a solution.  Another theme throughout the conversation was that mathematics is not an activity done in isolation — it is a communal activity.  So the Needs will not be addressed by a single individual, rather a group, and likely involving many members of many diverse communities.

A solution is out there.  It will take a lot of grit to find it.  But mathematicians have got grit in spades.


Bay Area Mathematical Artists, VI

As I mentioned last time, this meeting took place at Santa Clara University.  As we have several participants in the South Bay area, many appreciated the shorter drive…it turns out this was the most well-attended event to date.  Even better, thanks to Frank, the Mathematics and Computer Science Department at Santa Clara University provided wonderful pastries, coffee, and juice for all!

Our first speaker was Frank A. Farris, our host at Santa Clara University.  (Recall that last month, he presented a brief preview of his talk.)  His talk was about introducing a sound element into his wallpaper patterns.

In order to do this, he used frequencies based on the spectrum of hexagonal and square grids.  It’s not important to know what this means — the main idea is that you get frequencies that are not found in western music.

Frank’s idea was to take his wallpaper patterns, and add music to them using these non-traditional frequencies.  Here is a screenshot from one of his musical movies:

Day135AmaryllisPMG

Frank was really excited to let us know that the San Jose Chamber Orchestra commissioned work by composer William Susman to accompany his moving wallpaper patterns.  The concert will take place in a few weeks; here is the announcement, so you are welcome to go listen for yourself!

Day135susman_farris invite_18

Frank has extensive information about his work on his website http://math.scu.edu/~ffarris/, and even software you can download to make your very own wallpaper patterns.  Feel free to email him with any questions you might have at ffarris@scu.edu.

The second talk, Salvador Dali — Old and New, was given by Tom Banchoff, retired from Brown University.  He fascinated us with the story of his long acquaintance with Salvador Dali.  It all began with an interview in 1975 with the Washington Post about Tom’s work in visualizing the fourth dimension.

He was surprised to see that the day after the interview, the article Visual Images And Shadows From The Fourth Dimension in the next day’s Post, as well as a picture of Dali’s Corpus Hypercubus (1954).

Dali_Crucifixion_hypercube
Salvador Dali’s Crucifixion (Corpus Hypercubus)

But Tom was aware that Dali was very particular about giving permission to use his work in print, and knew that the Post didn’t have time to get this permission in such a short time frame.

The inevitable call came from New York — Dali wanted to meet Tom.  He wondered whether Dali was simply perturbed that a photo of his work was used without permission — but luckily, that was not the reason for setting up the meeting at all.  Dali was interested in creating stereoscopic oil paintings, and stereoscopic images were mentioned in the Post article.

Thus began Tom’s long affiliation with Dali.  He mentioned meeting Dali eight or nine times in New York (Dali came to New York every Spring to work), three times in Spain, and once in France.  Tom remarked that Dali was the most fascinating person he’d ever met — and that includes mathematicians!

Day135Dali
Tom with Salvador Dali.

Then Tom proceeded to discuss the genesis of Corpus Hypercubus.  His own work included collaboration with Charles Strauss at Brown University, which included rendering graphics to help visualize the fourth dimension — but this was back in the 1960’s, when computer technology was at its infancy.  It was a lot more challenging then than it would be today to create the same videos.

Day135net
Tom’s rendition of a hypercube net.

He also spent some time discussing a net for the hypercube, since a hypercube net is the geometrical basis for Dali’s Corpus Hypercubus.  What makes understanding the fourth dimension difficult is imagining how this net goes together.

It is not hard to imagine folding a flat net of six squares to make a cube — but in order to do that, we need to fold some of the squares up through the third dimension.  But to fold the hypercube net to make a hypercube without distorting the cubes requires folding the cubes up into a fourth spatial dimension.

This is difficult to imagine!  Needless to say, this was a very interesting discussion, and challenged participants to definitely think outside the box.

Tom remarked that Dali’s interest in the hypercube was inspired by the work of Juan de Herrera (1530-1597), who was in turn inspired by Ramon Lull (1236-1315).

Tom also mentioned an unusual project Dali was interested in near the end of his career.  He wanted to design a horse that when looked at straight on, looks like a front view of a horse.  But when looked from the side, it’s 300 meters long!  For more information, feel free to email Tom at banchoff@math.brown.edu.

Day135horse
Dali’s sketch of the horse.

Suffice it to say that we all enjoyed Frank’s and Tom’s presentations.  The change of venue was welcome, and we hope to be at Santa Clara again in the future.

Following the talks, Frank generously invited us to his home for a potluck dinner!  He provided lasagna and eggplant parmigiana, while the rest of us provided appetizers, salads, side dishes, and desserts.

As usual, the conversation was quite lively!  We talked for well over two hours, but many of us had a bit of a drive, so we eventually needed to make our collective ways home.

Next time, on April 7, we’ll be back at the University of San Francisco.  At this meeting, we’ll go back to shorter talks in order to give several participants a chance to participate.  Stay tuned for a summary of next month’s talks!

Bay Area Mathematical Artists, V.

The Spring semester is now well underway!  This means it’s time for the Bay Area Mathematical Artists to begin meeting.  This weekend, we had our first meeting of 2018 at the University of San Francisco.

As usual, we began informally at 3:00, giving everyone plenty of time to make it through traffic and park.  This time we had three speakers on the docket:  Frank A. Farris, Phil Webster, and Roger Antonsen.

Frank started off the afternoon with a brief presentation, giving us a teaser for his upcoming March talk on Vibrating Wallpaper.  Essentially, using the complex analysis of wave forms, he takes digital images and creates geometrical animations with musical accompaniment from them.  A screenshot of a representative movie is shown below:

Day130Farris1

You can click here to watch the entire movie.  More details will be forthcoming in the next installment of the Bay Area Mathematical Artists (though you can email him at ffarris@scu.edu if you have burning questions right now).  Incidentally, the next meeting will be held at Frank’s institution, Santa Clara University; he has generously offered to host one Saturday this semester as we have several participants who drive up from the San Jose area.

Our second speaker was Phil Webster, whose talk was entitled A Methodology for Creating Fractal Islamic Patterns.  Phil has been working with Islamic patterns for about five years now, and has come up with some remarkable images.

Day130Phil1

Here, you can see rings of 10 stars at various levels of magnification, all nested very carefully within each other.  While it is fairly straightforward to iterate this process to create a fractal image, a difficulty arises when the number and size of rosettes at a given level of iteration are such that they start overlapping.  At this point, a decision must be made about which rosettes to keep.

This decision involves both mathematical and artistic considerations, and is not always simple.  One remark Phil hears fairly often is that he’s actually creating a model of the hyperbolic plane, but this is in fact not the case.  Having sat down with him while he explained his methodology to me, I can attest to this fact.  His work may be visually somewhat reminiscent of the hyperbolic plane, but the mathematics certainly is not.

Moreover, in addition to creating digital prints, Phil has also experimented with laser cutting Islamic patterns, as shown in the intricate pieces below.

Day130Phil2

If you would like to learn more about Phil’s Islamic fractal patterns, feel free to email him at phil@philwebsterdesign.com.

We ended with a talk by Roger Antonsen, From Simplicity to Complexity.  Roger is giving a talk at the Museum of Mathematics in New York City next month, and wanted a chance to try out some ideas.  He casually remarked he had 377 slides prepared, and indicated he needed to perhaps trim that number for his upcoming talk….

Roger remarked that as mathematicians, we know on a hands-on basis how very simple ideas can generate enormous complexity.  But how do you communicate this idea to a general audience, many who are children?  This is his challenge.

2018-02-03 From Simplicity to Complexity.012

The idea of this “tryout” was that Roger would share some of his ideas with us, and we would give him some feedback on what we thought.  One idea that was very popular with participants was a discussion of Langton’s ant.  There are several websites you can visit — but to see a quick overview, visit the Wikipedia page.

The rules are simple (as you will already know if you googled it!).  An ant starts on a grid consisting totally of white squares.  If the ant is on a white square, it turns right a quarter-turn, moves ahead one square, and the square the ant was on turns to black.  But if the ant is on a black square, it turns left a quarter-turn, moves one unit, and the square the ant was on turns to white.

It seems like a fairly simple set of rules.  As the ant starts moving around, it seems to chaotically color the squares black and white in a random sort of pattern.

LangtonsAnt
From the Wikipedia commons, user Krwawobrody.

The image above shows the path of the ant after 11,000 steps (with the red pixel being the last step).  Notice that the path has started to repeat, and continues to repeat forever!

Why?  No one really knows.  Yes, we can see that it actually does repeat, but only sometime after 10,000 apparently random steps.  The behavior of this system has all of a sudden become very mysterious, without a clear indication of why.

If the rules for moving the ant always resulted in just random-looking behavior, perhaps no one would have looked any further.  But there are so many surprises.  Especially since  there is no reason you have to stick to the rules above.  As suggested in the Wikipedia article, you can add more colors, more rules, and even more ants….

For example, consider the set of rules in the following image.  It should be relatively self-explanatory by now:  there are four colors; if the ant is on a black square, turn right a quarter-turn and move forward one unit, then change the color of the square the ant was on to white; then continue (where green squares becomes black, in cyclic order).

2018-02-03 From Simplicity to Complexity 54.001

This looks like a cardiod!  And if you actually zoom in enough, you’ll see that this is the image after 500,000,000 iterations…though again, no one has the slightest idea why this happens.  Why should a simple set of rules based on 90° rotations generate a cardioid, of all things?

From the simple to the complex!  This was only one of literally dozens of topics Roger was able to elaborate on — and he illustrated each one he showed us with compelling images and animations.  For more examples, please see his web page, or feel free to email him at rantonse@ifi.uio.no.  You can also see the announcement for his MoMath talk here.

As usual, we went our for dinner afterwards, this time for Thai.  It seems that no one wanted to leave — but some of the participants had a 90-minute drive ahead of them, so eventually we had to head home.  Stay tuned for the summary of next month’s meeting, which will be at Santa Clara University!

Bay Area Mathematical Artists, IV.

We had our last meeting of the Bay Area Mathematical Artists in 2017 this weekend!  We had a somewhat lower turnout than usual since we’re moving into the holiday season.  But it really wasn’t possible to move the seminar a week earlier, since many of us affiliated with universities were in the middle of Final Exams.

As we had been doing before, we began with a social half hour while waiting for everyone to show up.  We then moved on to the more formal part of the afternoon.

There were three speakers originally slated to give presentations, but one had to cancel due to illness.  Still, we had two very interesting talks.

The first talk, Squircular Calculations, was given by Chamberlain Fong.  Chamberlain did speak at the inaugural September meeting, but wanted a chance to practice a new talk he will be giving at the Joint Mathematics Meetings in San Diego this upcoming January.

jmmscreen

So what is a squircle?  Let’s start with a well-known family of curves parameterized by p > 0:

|x|^p+|y|^p=1.

When p = 2, this gives the usual equation for a circle of radius 1 centered at the origin.  As p increases, this curve more and more closely approaches a square, and it is often said that “p = ∞” is in fact a square.

However, in Chamberlain’s opinion, the algebra becomes a bit unwieldy with this way of moving from a circle to a square.  He prefers the following parameterization:

x^2+y^2-s^2x^2y^2=1,

where s = 0 gives a circle, and the central portion of the curve when s = 1 is a square.  As s varies continuously from 0 to 1, the central portion of this curve continuously transforms from a circle to a square.  This parameterization was created by Manuel Fernandez Guasti; you can read his original paper here.

Chamberlain’s talk was about extending this idea in various ways into three dimensions.  He showed images of squircular cylinders, squircular cones, etc., and also gave equations in three-dimensional Cartesian coordinates for all these surfaces.  You can see some of the images in the title page of his presentation above.  It was quite fascinating, and there were lots of questions for Chamberlain when his talk was finished.  Feel free to email him at chamb3rlain@yahoo.com if you have further questions about squircles.

The second talk was given by Dan Bach (also a speaker at our inaugural meeting), entitled Making Curfaces with Mathematica.  Yes, “curfaces,” not “surfaces”!

Day124DanBach

Dan took us through a tour of his very extensive library of Mathematica-generated images.  He is fond of describing curves using parameters, and then changing the parameters over and over again to generate new images.

This is easy to do in Mathematica using the “Manipulate” command; below is a screen shot from Mathematica’s online documentation showing an example.

Day124Mma

The parameter n is used in plotting a simple sine function — as you move the slider, the graph changes dynamically.  Note that any numerical parameter may be experimented with in this way.  Simply make a slider and watch how your image changes with the varying parameter.

So what are “curfaces”?  Dan uses the term for images create by a family of closely related curves which, when graphed together, suggest a surface.  As we see in the example above, the family of curves suggests a spiraling ribbon in which several brightly colored balls are nestled.  Dan showed several more examples of this and discussed the process he used to create them.  To see more examples, you can visit his website www.dansmath.com or email him at art@dansmath.com.

Once the talks were over, we had some time for puzzles!  Earlier in the week, when I knew we were not going to have an overabundance of talks, I asked participants to bring some of their favorite puzzles so we could all have some fun after the talks.  We were all intrigued with the wide variety of puzzles participants brought.

My dissection puzzle was actually quite popular — that is, until a few of the participants solved it!

Day124Dissection

You might recognize this from my recent blog post on geometrical dissections.  The pieces above are arranged to make a square, but they may also be rearranged to make an irregular dodecagon.  Some asked if I had any more copies of this puzzle, but unfortunately, I didn’t.  Maybe I’ll have to start making some….

As has been our tradition, many of us went out to dinner afterwards.  We went to our favorite nearby Indian buffet, and engaged in animated conversation.  Interestingly, after talking a bit about mathematics and art, Chamberlain began entertaining us with his wide repertoire of word puzzles.

To give just one example, he asked us to come up with what he calls “mismisnomers.”  Usually, the prefix “mis-” means to incorrectly take an action, as in “misspell.”  But some words, like “misnomer,” begin with “mis-,” while the remainder of the word, “nomer” is not even a word!  How many mismisnomers can you think of?  This and similar amusing puzzles kept us going for quite a while, until it was finally time to head home for the evening.

So that’s all for the Bay Area Mathematical Artists in 2017.  Stay tuned in 2018…our first meeting next year will be at the end of January, and I’ll be sure to let you know how it goes!

Mathematics and Digital Art: Final Update (Fall 2017)

Yes, it is the end of another semester of Mathematics and Digital Art!  It was a very different semester than the first two, as I have mentioned in previous posts, since I began the semester with Processing right away.  There are still a few wrinkles to iron out — for example, we had a lab project on interactivity (involving using key presses to change features of the movie as it is running) which was quite a bit more challenging than I expected it would be.  But on the whole, I think it was an improvement.

So in this final post for Fall 2017, I’d like to share some examples of student work.  In particular, I’ll look at some examples from the Fractal Movie Project, as well as examples of Final Projects.

Recall that the Fractal Movie Project involves using linear interpolation on the parameters in affine transformations in order to make an animated series of fractal images.  One student experimented with a bright color palette against a black background.  As the fractal morphed, it actually looked like the red part of the image rotated in three dimensions, even though the affine transformations were only two-dimensional.

MAK


Cissy wanted to explore the motion of rain in her movie.  Although she began with bright colors on a black background, once she saw her fractal in motion, she decided that more subtle colors on a white background would be better suited to suggest falling raindrops being blown about by the wind.MCissy


Sepid also incorporated movement in her movie — she created a rotating galaxy with a color palette inspired by the colors of the Aurora Borealis.  In addition, she learned how to use the Minim library so she could incorporate sound into her movie as well.  Here is a screen shot from her movie.

MSepid


Now let’s take a look at a few Final Projects.  Recall that these projects were very open-ended so that students could go in a direction of their choice.  Some really got into their work, with truly inspirational results.  The presentation that Sepid gave at a recent meeting of the Bay Area Mathematical Artists was actually work she was doing on her Final Project (read about it here).

Terry took on an ambitious project. She based her work on a Bridges paper by Adam Colestock, Let the Numbers Do the Walking: Generating Turtle Dances on the Plane from Integer Sequences (read the paper here).  Terry did have some programming experience coming into the course, and so she decided to code all of Adam’s turtle graphics algorithms from scratch! This was no simple task, but she worked hard and eventually accomplished her goal.

Here is a screen shot from one of her movies; Terry wanted to create an interesting visual effect by overlaying multiple copies of the same turtle path.  Since this particular path was not too dense in the plane, she was able to work with thicker lines.

FPTerry

Tera created a movie which involved rotating triangles and moving dots.  Her movie had a strong sense of motion, and incorporated a vibrant color palette. She remarked that working with color in this project was both fun and quite challenging. In her words, “Playing nicely with hot pink is not an easy feat.”

FP_TG


I would also like to share the fact that Professor Roza Aceska of Ball State University (Muncie, Indiana) will be teaching a course about digital art next semester using Processing which will be incorporating a lot of my course materials.  I am very excited about this!  Many faculty who come to my talks say they are interested in teaching such a course, but getting Department Chairs and Deans to approve such courses is sometimes an uphill battle.

Professor Aceska’s course will be a bit different from mine — her course is in the Honors Program, and as such, does not count as a mathematics credit.  So she will not have most of the mathematics assignments and quizzes that I had in my course.  But she will still be emphasizing the fascinating relationship between mathematics, programming, and art.  I hope to write more about her course sometime during the next semester.

One final remark — I am helping to organize a Mathematical Art Exhibition at the Golden Section Meeting of the Mathematical Association of America on February 24, 2018 at the California State University, East Bay.  So if you’re reading this and are in the Bay Area and would like to submit some mathematical art for inclusion in our exhibit, please let me know!


Bay Area Mathematical Artists, III

Another successful meeting of the Bay Area Mathematical Artists took place yesterday at the University of San Francisco!  It was our largest group yet — seventeen participants, include three new faces.  We’re gathering momentum….

Like last time, we began with a social half hour from 3:00–3:30.  This gave people plenty of time to make their way to campus.  I didn’t have the pleasure of participating, since the campus buildings require a card swipe on the weekends; I waited by the front door to let people in.  But I did get to chat with everyone as they arrived.

We had a full agenda — four presenters took us right up to 5:00.  The first speaker was Frank A. Farris of Santa Clara University, who gave a talk entitled Fibonacci Wallpaper Spirals.

p4IrisLoRes.jpg

He took inspiration from John Edmark’s talk on spirals at Bridges 2017 in Waterloo, which I wrote about in my blog last August (click here to read more).  But Frank’s approach is rather different, since he works with functions in the complex plane.

He didn’t dive deeply into the mathematics in his talk, but he did want to let us know that he worked with students at Bowdoin College to create open-source software which will allow anyone to create amazing wallpaper patterns.  You can download the software here.

Where do the Fibonacci numbers come in?  Frank used the usual definition for the Fibonacci numbers, but used initial values which involved complex numbers instead of integers.  This allowed him to create some unusually striking images.  For more details, feel free to contact him at ffarris@scu.edu.

Next was our first student talk of the series, My Experience of Learning Math & Digital Art, given by Sepid Ebrahimi.  Sepid is a student in my Mathematics and Digital Art course; she is a computer science major and is really enjoying learning to code in Processing.
Sepid
First, Sepid mentioned wanting to incorporate elements into her work beyond simple points, circles, and rectangles.  Her first project was to recreate an image of Rick and Morty, the two main characters in the eponymous cartoon series.  She talked about moving from simple blocks to bezier curves in order to create smooth outlines.
Sepid then discussed her second project, which she is using for her Final Project in Mathematics and Digital Art.  In order to incorporate sound into her work, she learned to program in Java to take advantage of already-existing libraries.  She is creating a “live audio” program which takes sound input in real time, and based on the frequencies of the sound, changes the features of various geometrical objects in the video.  Her demo was very fascinating, and all the more remarkable since she just started learning Processing a few months ago.  For more information, you can contact Sepid at sepiiid.ebra@gmail.com.
The third talk, Conics from Polygons: the Chord Ratio Construction, was given by Scott Vorthmann.  He is spreading the word about vZome, an open-source virtual environment where you can play with Zometools.
The basis of Scott’s talk was a simple chord ratio construction, which he is working on with David Hall.  (Here is the GeoGebra worksheet if you would like to play with it.)  The essential idea is illustrated below.
chordratio
Begin with two segments, the red and green ones along the coordinate axes.  Choose a ratio r.  Now add a chord parallel to the second segment and r times as long — this gives the thick green segment at y = 1.  Connect the dots to create the third segment, the thin green segment sloping up to the right at x = 1.  Now iterate — take the second and third segments, draw a chord parallel to the second segment and r times as long (which is not shown in the figure), and connect the dots to form the fourth segment (the thin green segment sloping to the left).
Scott then proceeded to show us how this very simple construction, when iterated over and over with multiple starting segments, can produce some remarkable images.
scott
Even though this is created using a two-dimensional algorithm, it really does look three-dimensional!  Conic sections play a fundamental role in the geometry of the points generated at various iterations.  Quadric surfaces in three dimensions also come into play as the two-dimensional images look like projections of quadric surfaces on the plane.  Here is the GeoGebra worksheet which produced the graphic above.  For more information, you can contact Scott at scott@vorthmann.org.
 The final presenter was Stacy Speyer, who is currently an artist-in-residence at Planet Labs.  (Click here to read more about art at Planet Labs.)  She didn’t give a slideshow presentation, but rather brought with her several models she was working on as examples of Infinite Polyhedra Experiments with Planet’s Satellite Imagery.
Planet-1stTryInfinte4_6.jpg
One ongoing project at Planet Labs is planetary imaging.  So Stacy is taking high-resolution topographical images and using them to create nets for polyhedra.  She is particularly interested in “infinite polyhedra” (just google it!).  As you can see in the image above, six squares meet at each vertex, and the polyhedron can be extended arbitrarily far in all directions.
One interesting feature of infinite polyhedra (as you will notice above) is that since you cannot actually create the entire polyhedron, you’ve got to stop somewhere.  This means that you can actually see both sides of all the faces in this particular model.  This adds a further dimension to artistic creativity.  Feel free to contact Stacy at cubesandthings@gmail.com for more information!
We’ll have one more meeting this year.  I am excited to see that we’re making so much progress in relatively little time.  Presentations next time will include talks being prepared for the Joint Mathematics Meetings in San Diego this coming January, so stay tuned!


Bay Area Mathematical Artists, II

Yesterday was the second meeting of the Bay Area Mathematical Artists!  We had a somewhat different group — some who came last time were unable to make it, but there were some new faces among the enthusiasts as well.  Fourteen showed up for the afternoon, and two others joined us for dinner afterwards.

After the last meeting, I received a few emails offering suggestions about different ways to organize the gatherings.  One suggestion was to have a social period for the first part of the meeting, where participants could meet those they didn’t already know, or perhaps bring artistic items for show-and-tell.

This seemed like a good idea, since in addition to letting participants get to know each other or just catch up on the previous month, it gave them a 30-minute buffer to arrive on campus.  It turns out this part of the afternoon went very well, with just about everyone arriving by 3:30.  Dan Bach was giving away old copies of mathematics journals he had collected over the years, while Colin Liotta was giving away laser-etched wooden pendants.

The only scheduled talk of the afternoon was given by Roger Antonsen, entitled Mathematical explorations and visualizations.

Day116Roger

Roger talked about several of his extensive library of Processing animations. He takes his inspiration from many different places – but his Processing mantra is sometimes “make it move.” He takes an image which fascinates him, recreates it as best as he can, and then varies different parameters to make the image move.

Some of his most intriguing examples involved optical illusions, and are based on the work of Pinna; see his web page on Art to see some examples.

He also emphasized the need to create balance in his work – when you parameterize features of an image, you need to decide the range the parameter takes. Too much motion, and the animation looks too distorted, but too little, and the animation is too static. Of course the need to create balance in artwork is not restricted to creating animations, but it is constantly in Roger’s mind as he creates.

After Roger’s talk, we moved on to a discussion about the nature of mathematical and digital art.  There are other similar terms in use, such as algorithmic art and generative art.  Typically, generative art is described as art generated by some autonomous system.  This means that algorithmic art — that is, art created by use of a computer program — is a subset of generative art.  But what do all these terms mean to us, individually, as artists?

I had originally thought to break into smaller groups at first, but the group wanted to have just one, larger discussion.

There were many and varied opinions expressed — from commentary about the art community as a whole, to those who thought the question “What is mathematical art?” is nonsensical to ask because there is really no answer, and it doesn’t impact the creative process at all.

Two points I made relate to my teaching Mathematics and Digital Art.  First, every time you settle on the value for a parameter in some work you’re doing, you are making an aesthetic choice.  You can tweak all you like, but then all of a sudden you just say to yourself, “OK, that’s it!”  Of course there are times you just stop because you can’t find precisely what you want and just need to move on, but I think you get the gist of what I’m saying.  You’re making artistic choices all the time.

And second, I have students write short narratives about their work, describing the parameter choices they make.  I want to them to think about when a digital image becomes a piece of digital art.  Of course (as alluded to above) there really is no definitive answer to this question, but for students just beginning to dive into the world of digital and mathematical art, it is a useful question to consider.

This took us right to our designated ending time, 5:00.  One of the participants suggested a Thai place nearby, and so eleven of us made the short trek just north of campus.  It was actually quite good, according to all accounts.  And as I mentioned earlier, two participants who couldn’t make it earlier in the day joined us at the restaurant.  The discussions were lively, covering a broad range of mathematics, art, and other topics as well.

So again, a good time was had by all!  To round out today’s post, I’d like to say a few words about the new Digital Art Club I’m advising at the University of San Francisco.  It seems each week, one or two more students become interested, mostly by word of mouth.  There are new faces all the time!

It turns out this is a great opportunity for mathematics or science majors to learn about digital art.  The Mathematics and Digital Art course I’m teaching is not at a high enough level to count towards a mathematics major, and many students in the sciences (like computer science or physics) have required mathematics courses, also at a higher level.

We’re focusing on learning Processing at the moment, since not only are students very interested in learning the software, but I have written quite a bit about Processing on my blog.  So I can easily get students started by pointing them to an appropriate post.

Not only that, we’ve got a few students willing to take leadership positions and secure status as an officially recognized student club.  This means there are funds available for field trips and other activities.  We’re hoping to make a trip to the Pace Gallery in Palo Alto.  I’ll occasionally update on our progress in future posts.  Stay tuned!

Mathematics and Digital Art: Update 2 (Fall 2017)

We’ve just completed Week 8 of the Fall semester, so it’s time for the next update on my Mathematics and Digital Art class!  As I had mentioned before, the major difference this semester was starting with Processing right from the beginning of the semester.

It turns out this is making a really big difference in the way the class is progressing.  The first two times I taught the course, I had students work in the Sage environment for the first half of the semester.  The second half of the semester was devoted to Processing and student projects.

Because students only started to learn Processing at the same time they were diving into their projects, they were not able to start off with a Processing-based project.  As it happened, a few students actually incorporated Processing into their final projects as the second half of the semester progressed, but this was the exception, not the rule.

But last week, we already started making movies in Processing!  Starting simply, of course, with the dot changing colors.


This was a bit easier to present this time around, since we already had a discussion of user space vs. screen space earlier in the semester.  So this time, I could really focus on linear interpolation — the key mathematical concept behind making animations.

Next week will be a Processing-intense week.  I’ll delay some topics — like geometric series — to a little later in the course so we can get more Processing in right now.  The reason?  I really think many students will involve Processing in their final projects in a significant way.  I want to make sure they have enough exposure to feel confident about going in that direction for their final projects.  I’ll let you know what happens in this regard in my next update of Mathematics and Digital Art.

Now for some examples of student work!  For the assignment on iterated function systems, students had three different images to submit.  The first was a Sierpinski triangle — I asked students to create an image simultaneously as close to and as far away from a Sierpinski triangle as possible.  The idea was that a viewer should recognize the image as being based on a Sierpinksi triangle, but perhaps only after staring at it for thirty seconds or so.

This is Sepid’s take on the assignment.  On many of her pieces, she experimented with different ways to crop the final image.  This has a significant effect on the image’s final appearance.

Day115Sepid1.png


This is Cissy’s submission for the Sierpinski triangle.  In this piece (and the others submitted for this assignment), Cissy remarked that she really enjoyed experimenting with color.  I commented that I thought color choices were among the most difficult decisions to make as far as elements of a work of digital art are concerned.

Day115Cissy1.png

The second piece was to involve only two affine transformations.  This is often a challenge for students, but there really is an enormous variety of images that may be created using just two transformations.  In addition, one of the transformations needed to involve a rotation by a non-trivial angle (that is, not a multiple of 45°), and students needed to submit a picture of their calculations as well.

One student was trying to create an image that looked like an animal footprint.  She remarked that she did consider a different color palette, but in the end, preferred to go with monochromaticity.
Day115L2.png

Interestingly, Terry also used a simple color palette.  She remarked that it was challenge to use just two transformations — and because of this minimalist requirement, decided to go with a minimalist color palette.  In addition, her resulting fractal reminded her of birds, so she set the fractal against a white moon and gray sky.

Day115Terry2

For the third submission, there were no constraints whatsoever — in fact, I encouraged students to be as creative as possible.  There was a very wide range of submissions.  One student was fairly minimalistic, using a highly contrasting color palette.

Day115A

Jack’s piece was also fairly minimalistic.  I should remark that we took part of a lab one day for students to do some online peer commenting; Jack (and others as well) remarked that he used the advice of another student to improve an earlier draft of his piece.  In particular, he adjusted the stroke weight to increase the intensity of the colors.

Day115Jack.png

Tera based her work on the Sierpinski triangle,  but also included reflections of each of the three smaller components of her version of the Sierpinski triangle.  She remarked that the final image reminded her of a snowflake, or perhaps a Christmas sweater.

Day115Tera.png

Alex’s inspiration came from The Great Wave off Kanagawa, by Katsushika Hokusai.

The_Great_Wave_of_Kanagawa.jpg
Courtesy the Wikipedia Commons.


First, he created the fractal image, experimenting with various color combinations.  When he was satisfied with his palette, he added the boat and the white circle to suggest a black moon.  A rather interesting approach!

Day115Alex.png

As you can see, I’ve got quite a creative class of students who are willing to experiment in many different ways.  It’s interesting for me, since there is no way to predict what they’ll create next!  I look forward to seeing what they create when they really dive deeply into Processing and begin making animations.

In the next update, I’ll report on how students involve Processing in their project proposals.  In addition, they will have submitted their fractal movie projects by then, so there will undoubtedly be many interesting examples of student work to exhibit.  Stay tuned!