Last week, we laid down some of the mathematical foundation needed to generate fractal images. In this third and final post about creating fractals, we’ll discuss in some detail Python code you can adapt to making your own designs. Follow along in this Sage notebook.
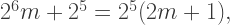
In order to produce fractal images iteratively, we need a function which returns the highest power of 2 within a positive integer (as discussed last week). It is not difficult to write a recursive routine to do this, as is seen in the notebook. This is really all we need to get started. The rest involves creating the graphics. I usually use PostScript for my images, like the one below discovered by Matthieu Pluntz. There isn’t time to go into that level of detail here, though.

As far as the graphics are concerned, it would be nice to have an easily described color palette. You might look here to find a wide range of predefined colors, which are available once we execute the “import mathplotlib” command (see Line 20). These names are used in the “colors” variable. Since each motif has four segments, I’ll color each one differently (though you may choose a different color scheme if you want to).
The loop is fairly straightforward. On each iteration, first find the correct angle to turn using the highestpowerof2 function. Then the segment to add on to the end of the path is

which represents converting from polar to rectangular coordinates. This is standard fare in a typical high school precalculus course. Note the color of the segment is determined by i % 4, since 0 is the index of the first element of any list in Python.
All there is left to do is output to the screen. We’re done! You can try it yourself. But note that the way I defined the function, you have to make the second argument negative (compare the image in the notebook with last week’s post). Be patient: some of these images may take a few moments to generate. It would definitely help the speed issue if you downloaded Sage on your own computer.
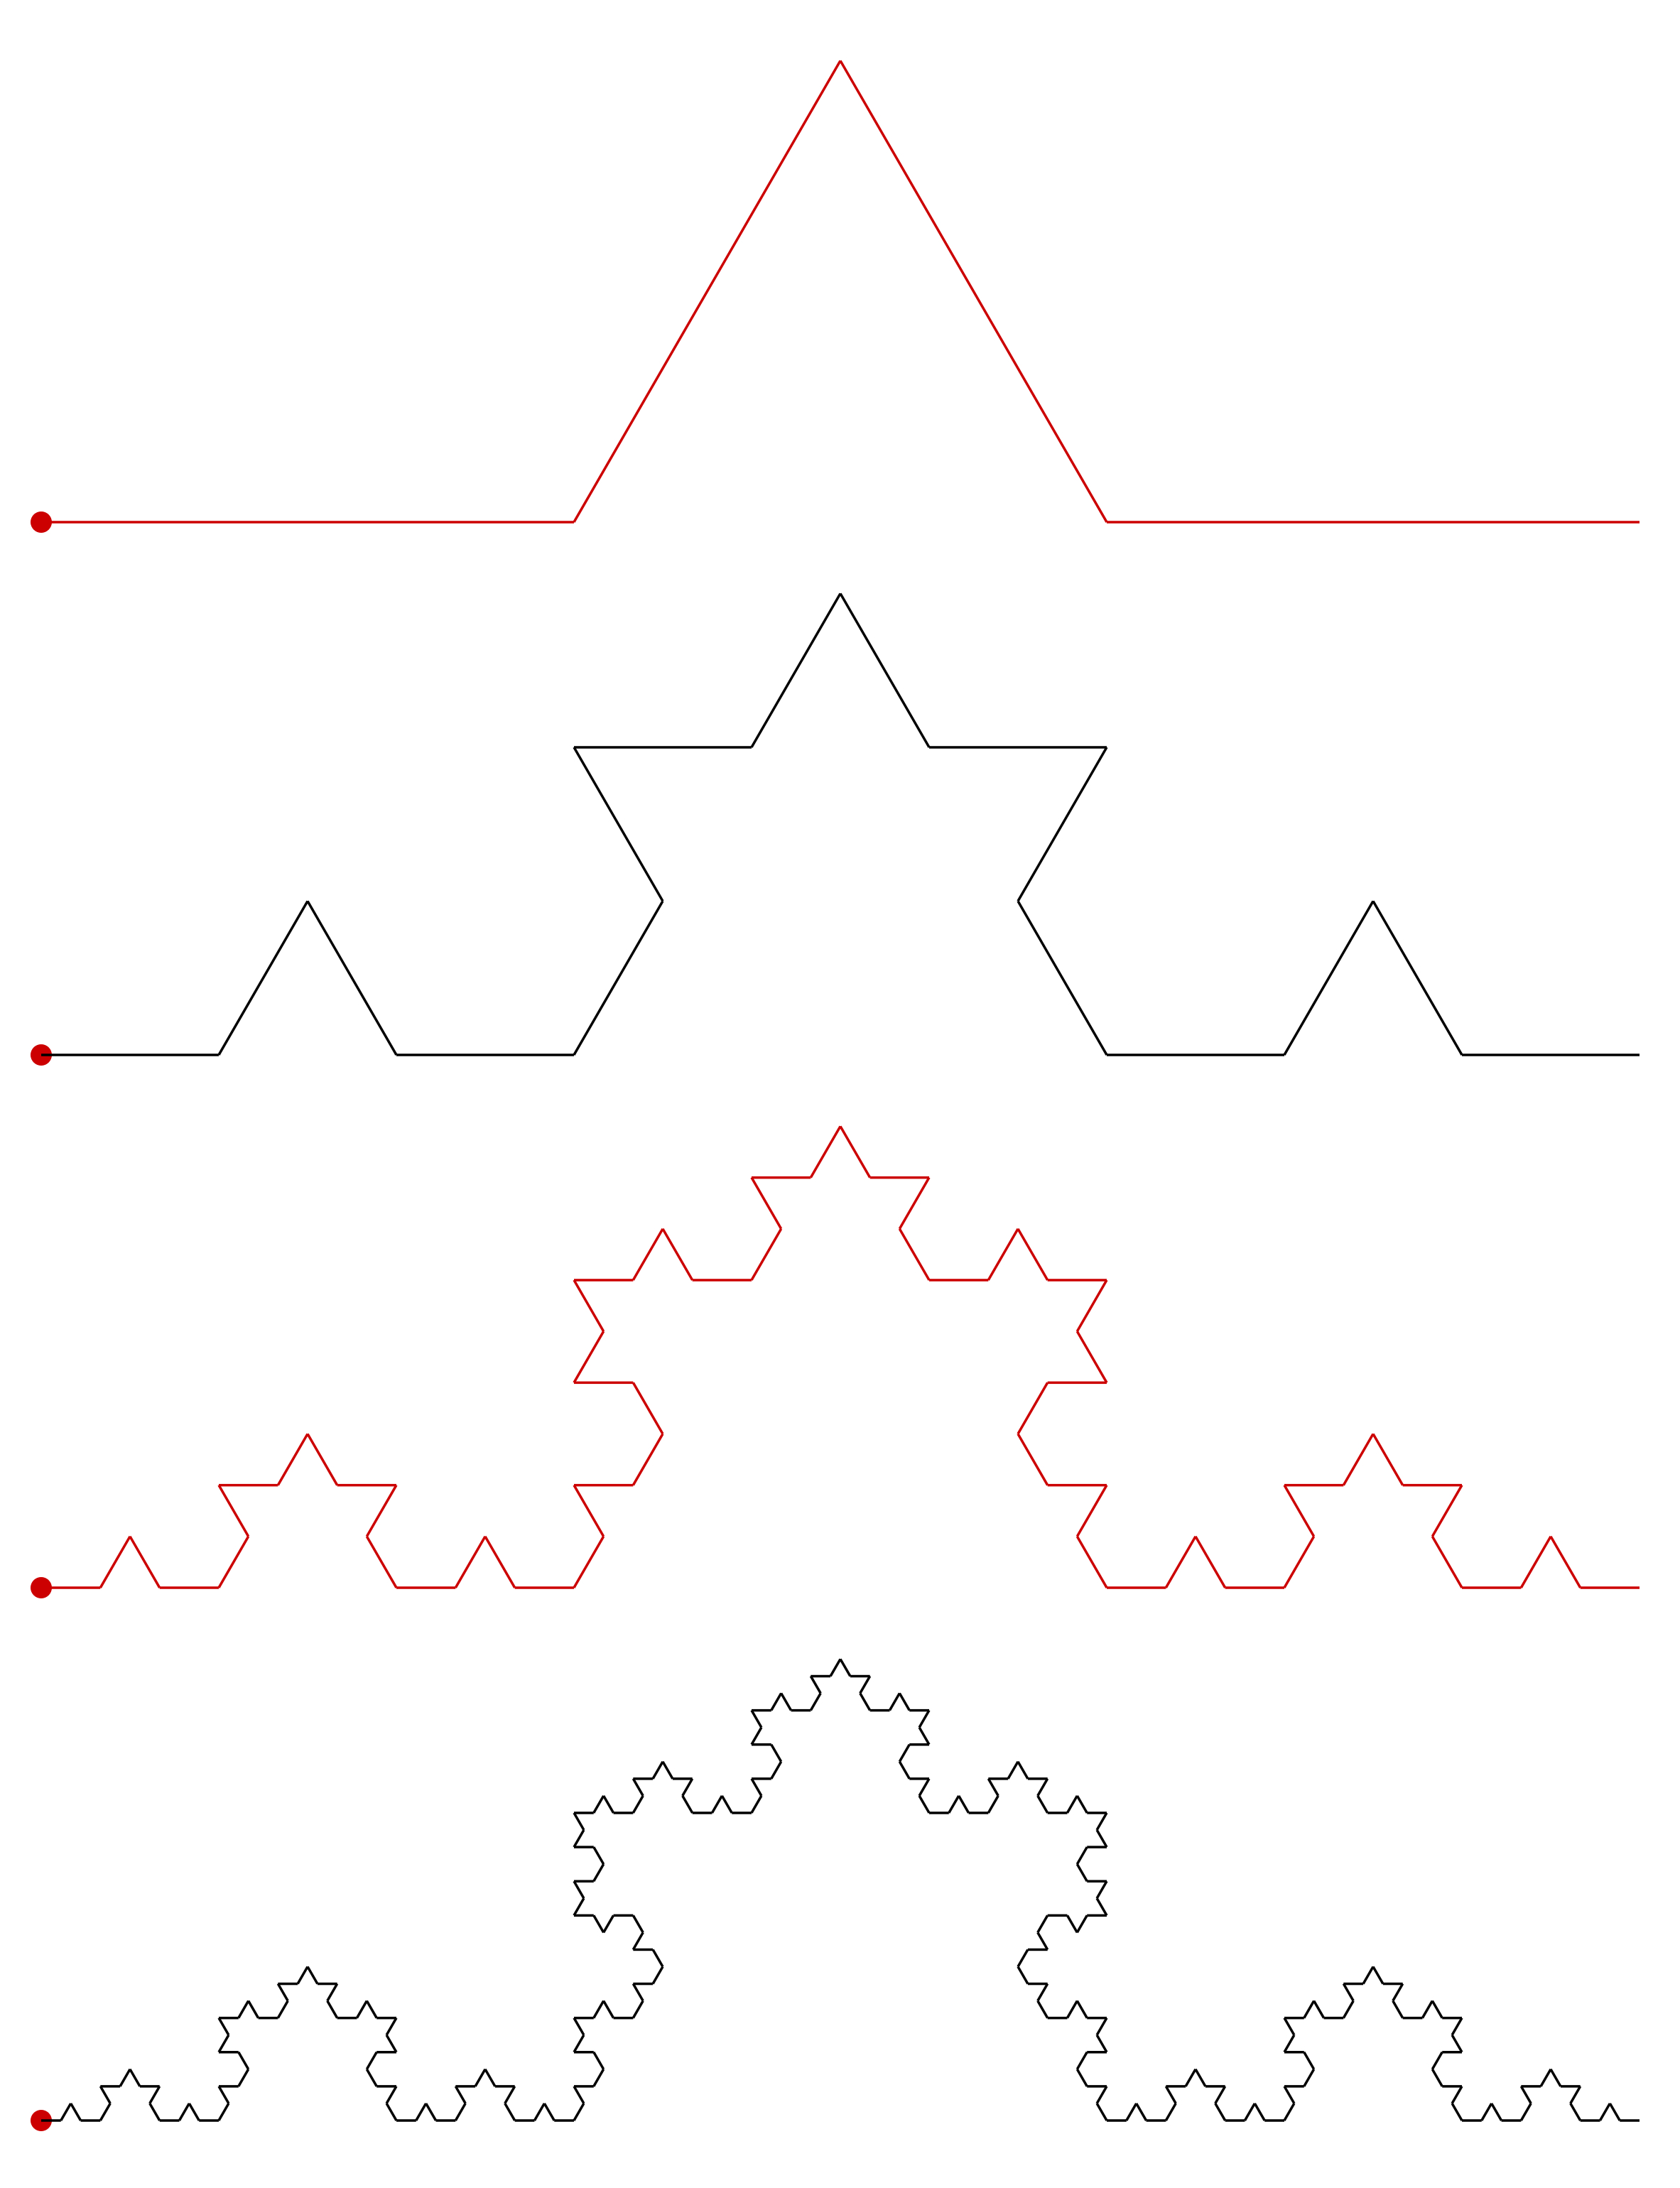
To create the image shown above, you need to use angles of 90 and -210 (I took the liberty of rotating mine 15 degrees to make it look more symmetrical). To create the image below, angles of 90 and -250 are used. However, 26,624 steps are needed to create the entire image! It is not practical to create an image this complex in the online Sage environment.
How do you know what angles to use? This is still an open question — there is no complete answer that I am aware of. After my first post on October 4, Matthieu Pluntz commented that he found a way to create an infinite variety of fractal images which “close up.” I asked him how he discovered these, and he responded that he used a recursive algorithm. It would take an entire post just to discuss the mathematics of this in detail — so for now, we’ll limit our discussion to how to use this algorithm. I’ve encoded it in the function “checkangles.”
To use this function, see the examples in the Sage notebook. Be careful to enter angles as negative when appropriate! Also, you need to enter a maximum depth to search, since perhaps the angles do not result in an image which “closes up,” such as with 11 and -169. But here’s the difficult part mathematically — just because our algorithm doesn’t find where 11 and -169 closes up does not mean that the fractal doesn’t close. And further, just because our algorithm produced a positive result does not mean the algorithm must close. Sure, we’ve found something that produces many results with interesting images — which suggests we’re on the right track. But corroboration by a computer program is not a proof.
At the end of the notebook, I wrote a simple loop illustrating how you can look for many possibilities to try at once. The general rule of thumb is that the more levels required in the algorithm to produce a pair of angles (which is output to the screen), the more segments needed to draw it. I just looked for an example which only required 5 levels, and it was fairly easy to produce.
So where do we go from here? Personally, I’ve found this investigation fascinating — and all beginning from a question by a student who is interested in learning more about fractals. I’ve tried to give you an idea of how mathematics is done in the “real world” — there is a lot of exploration involved. Proofs will come later, but it is helpful to look at lots of examples first to figure out what to prove. When I find out something significant, I’ll post about it.
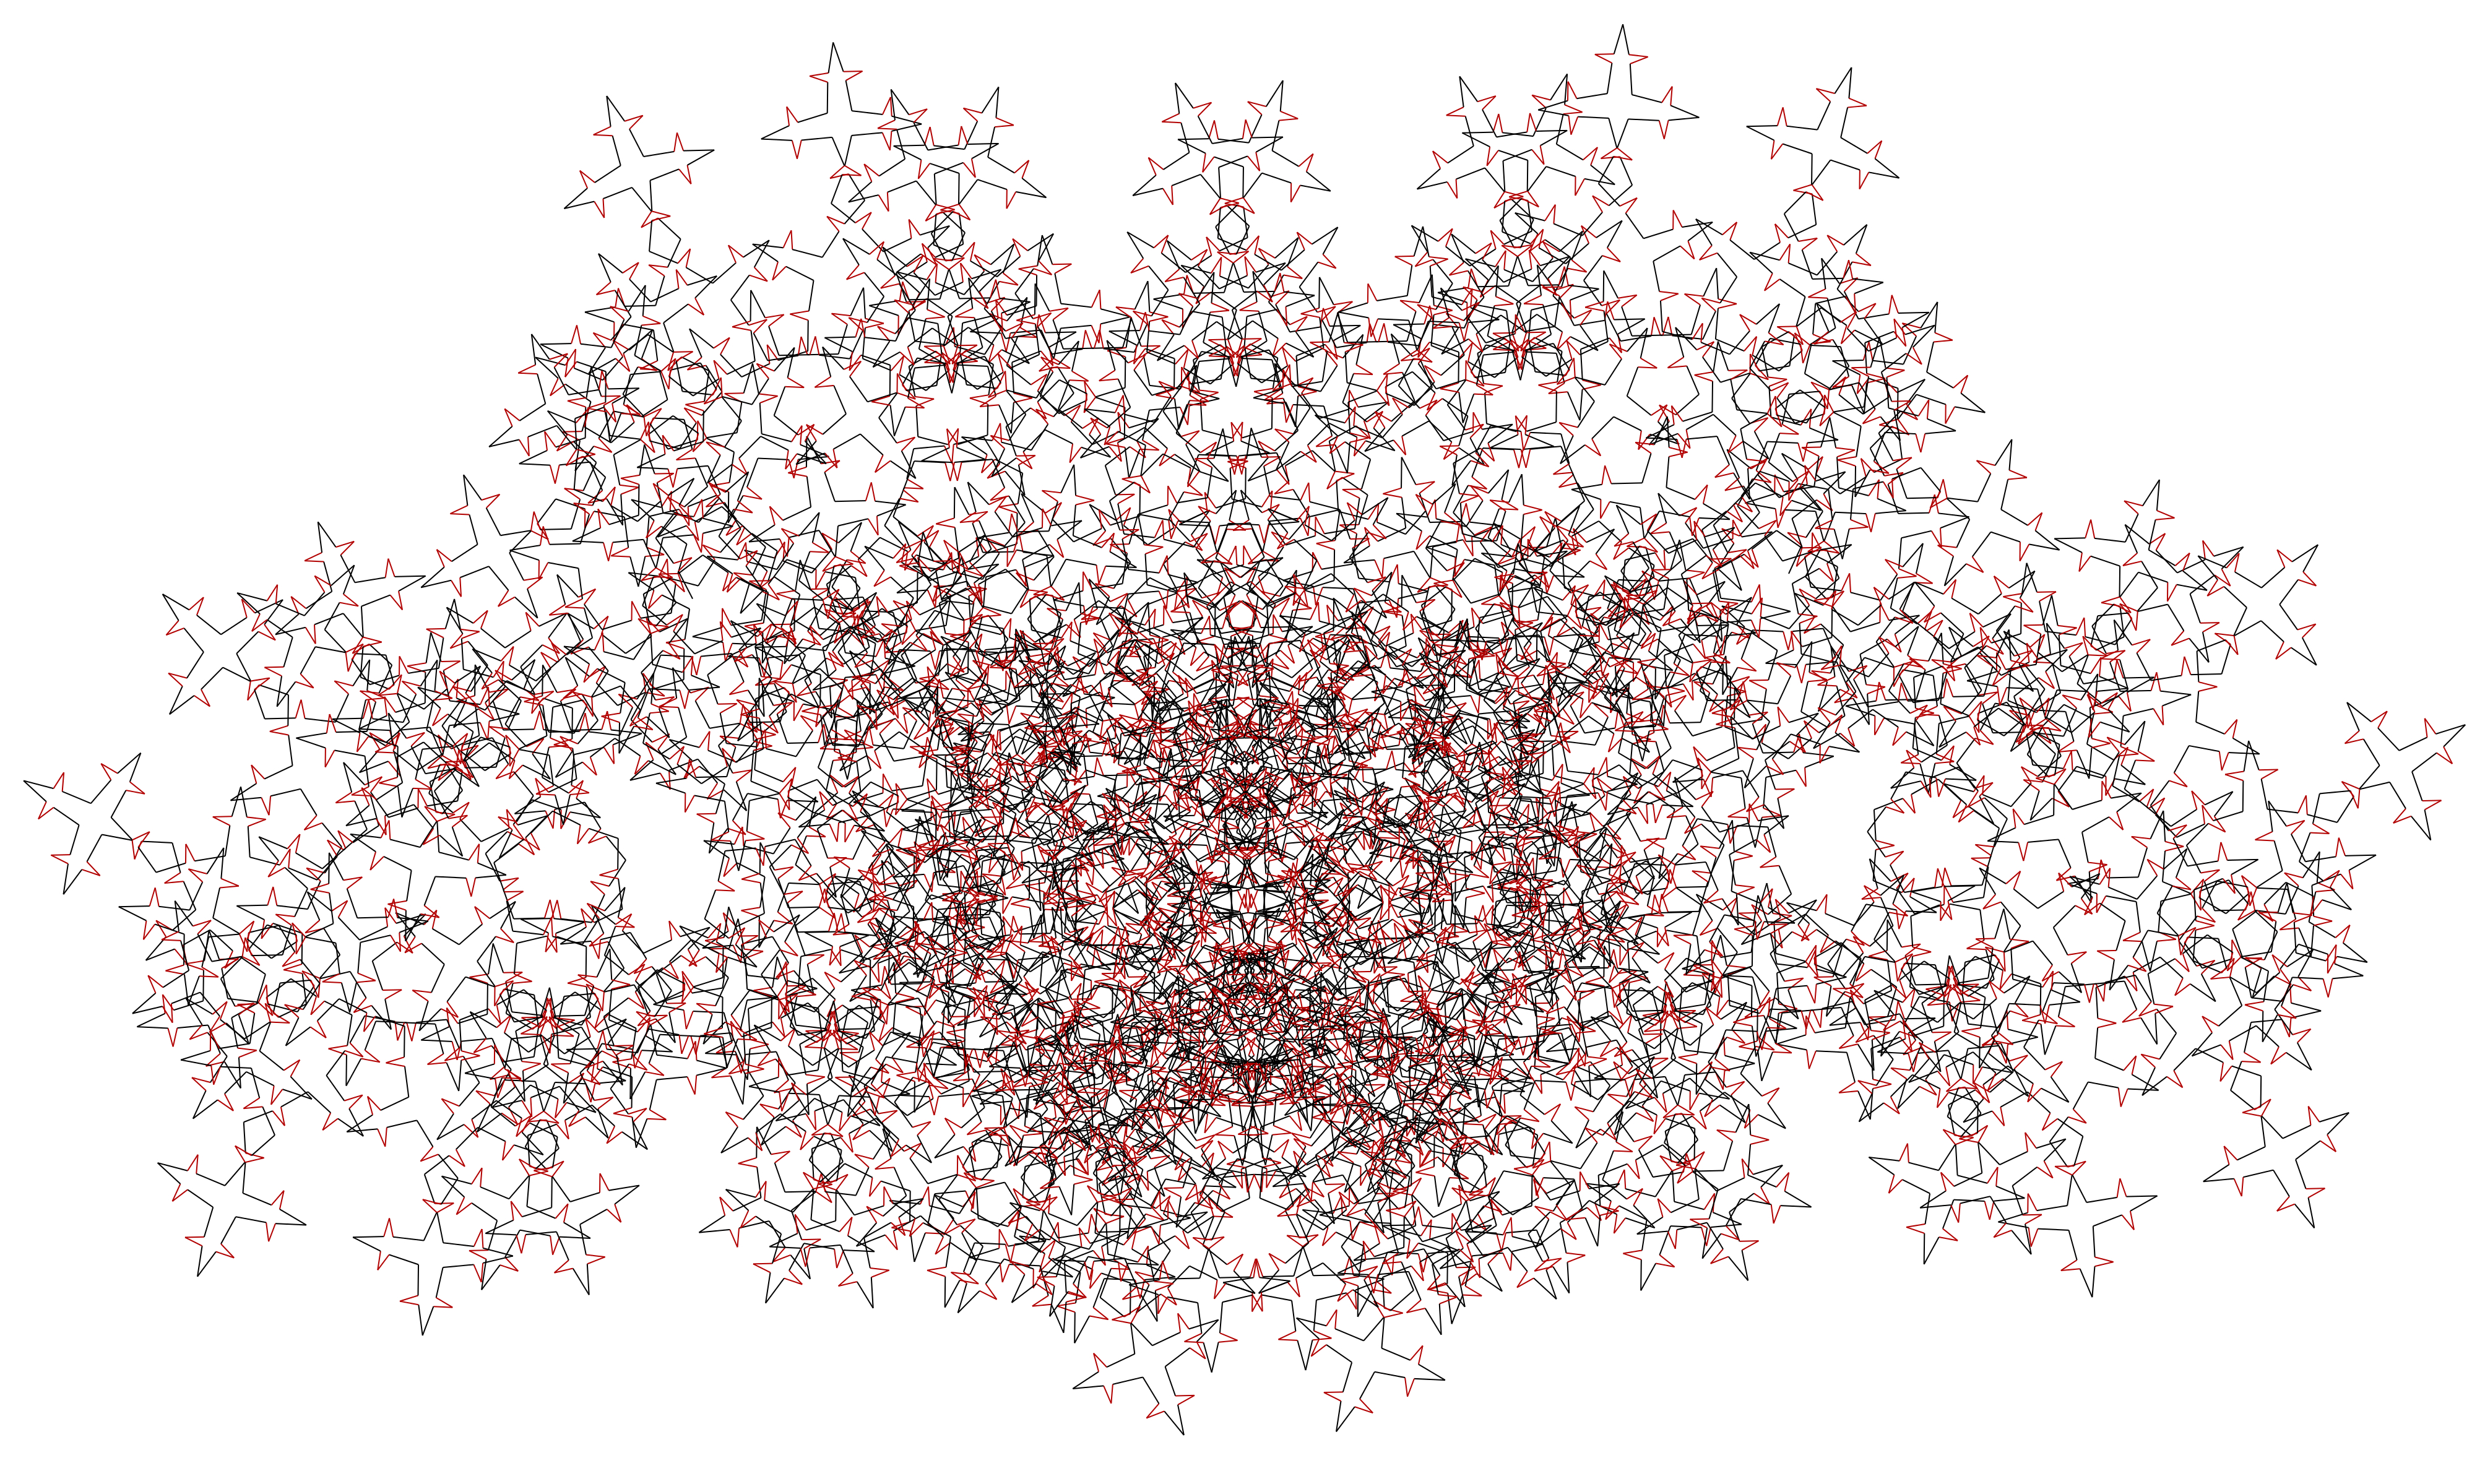
And I will admit a recent encounter with the bane of a programmer’s existence — the dreaded sign error. Yes, I had a minus sign where I should have had a plus sign. This resulted in my looking at lots of images which did not close up (instead of closing up, as originally intended). Some wonderful images resulted, though, like the one below with angles of 11 and -169. Note that since the figure does not close up (as far as I know), I needed to stop the iteration when I found a sufficiently pleasing result.
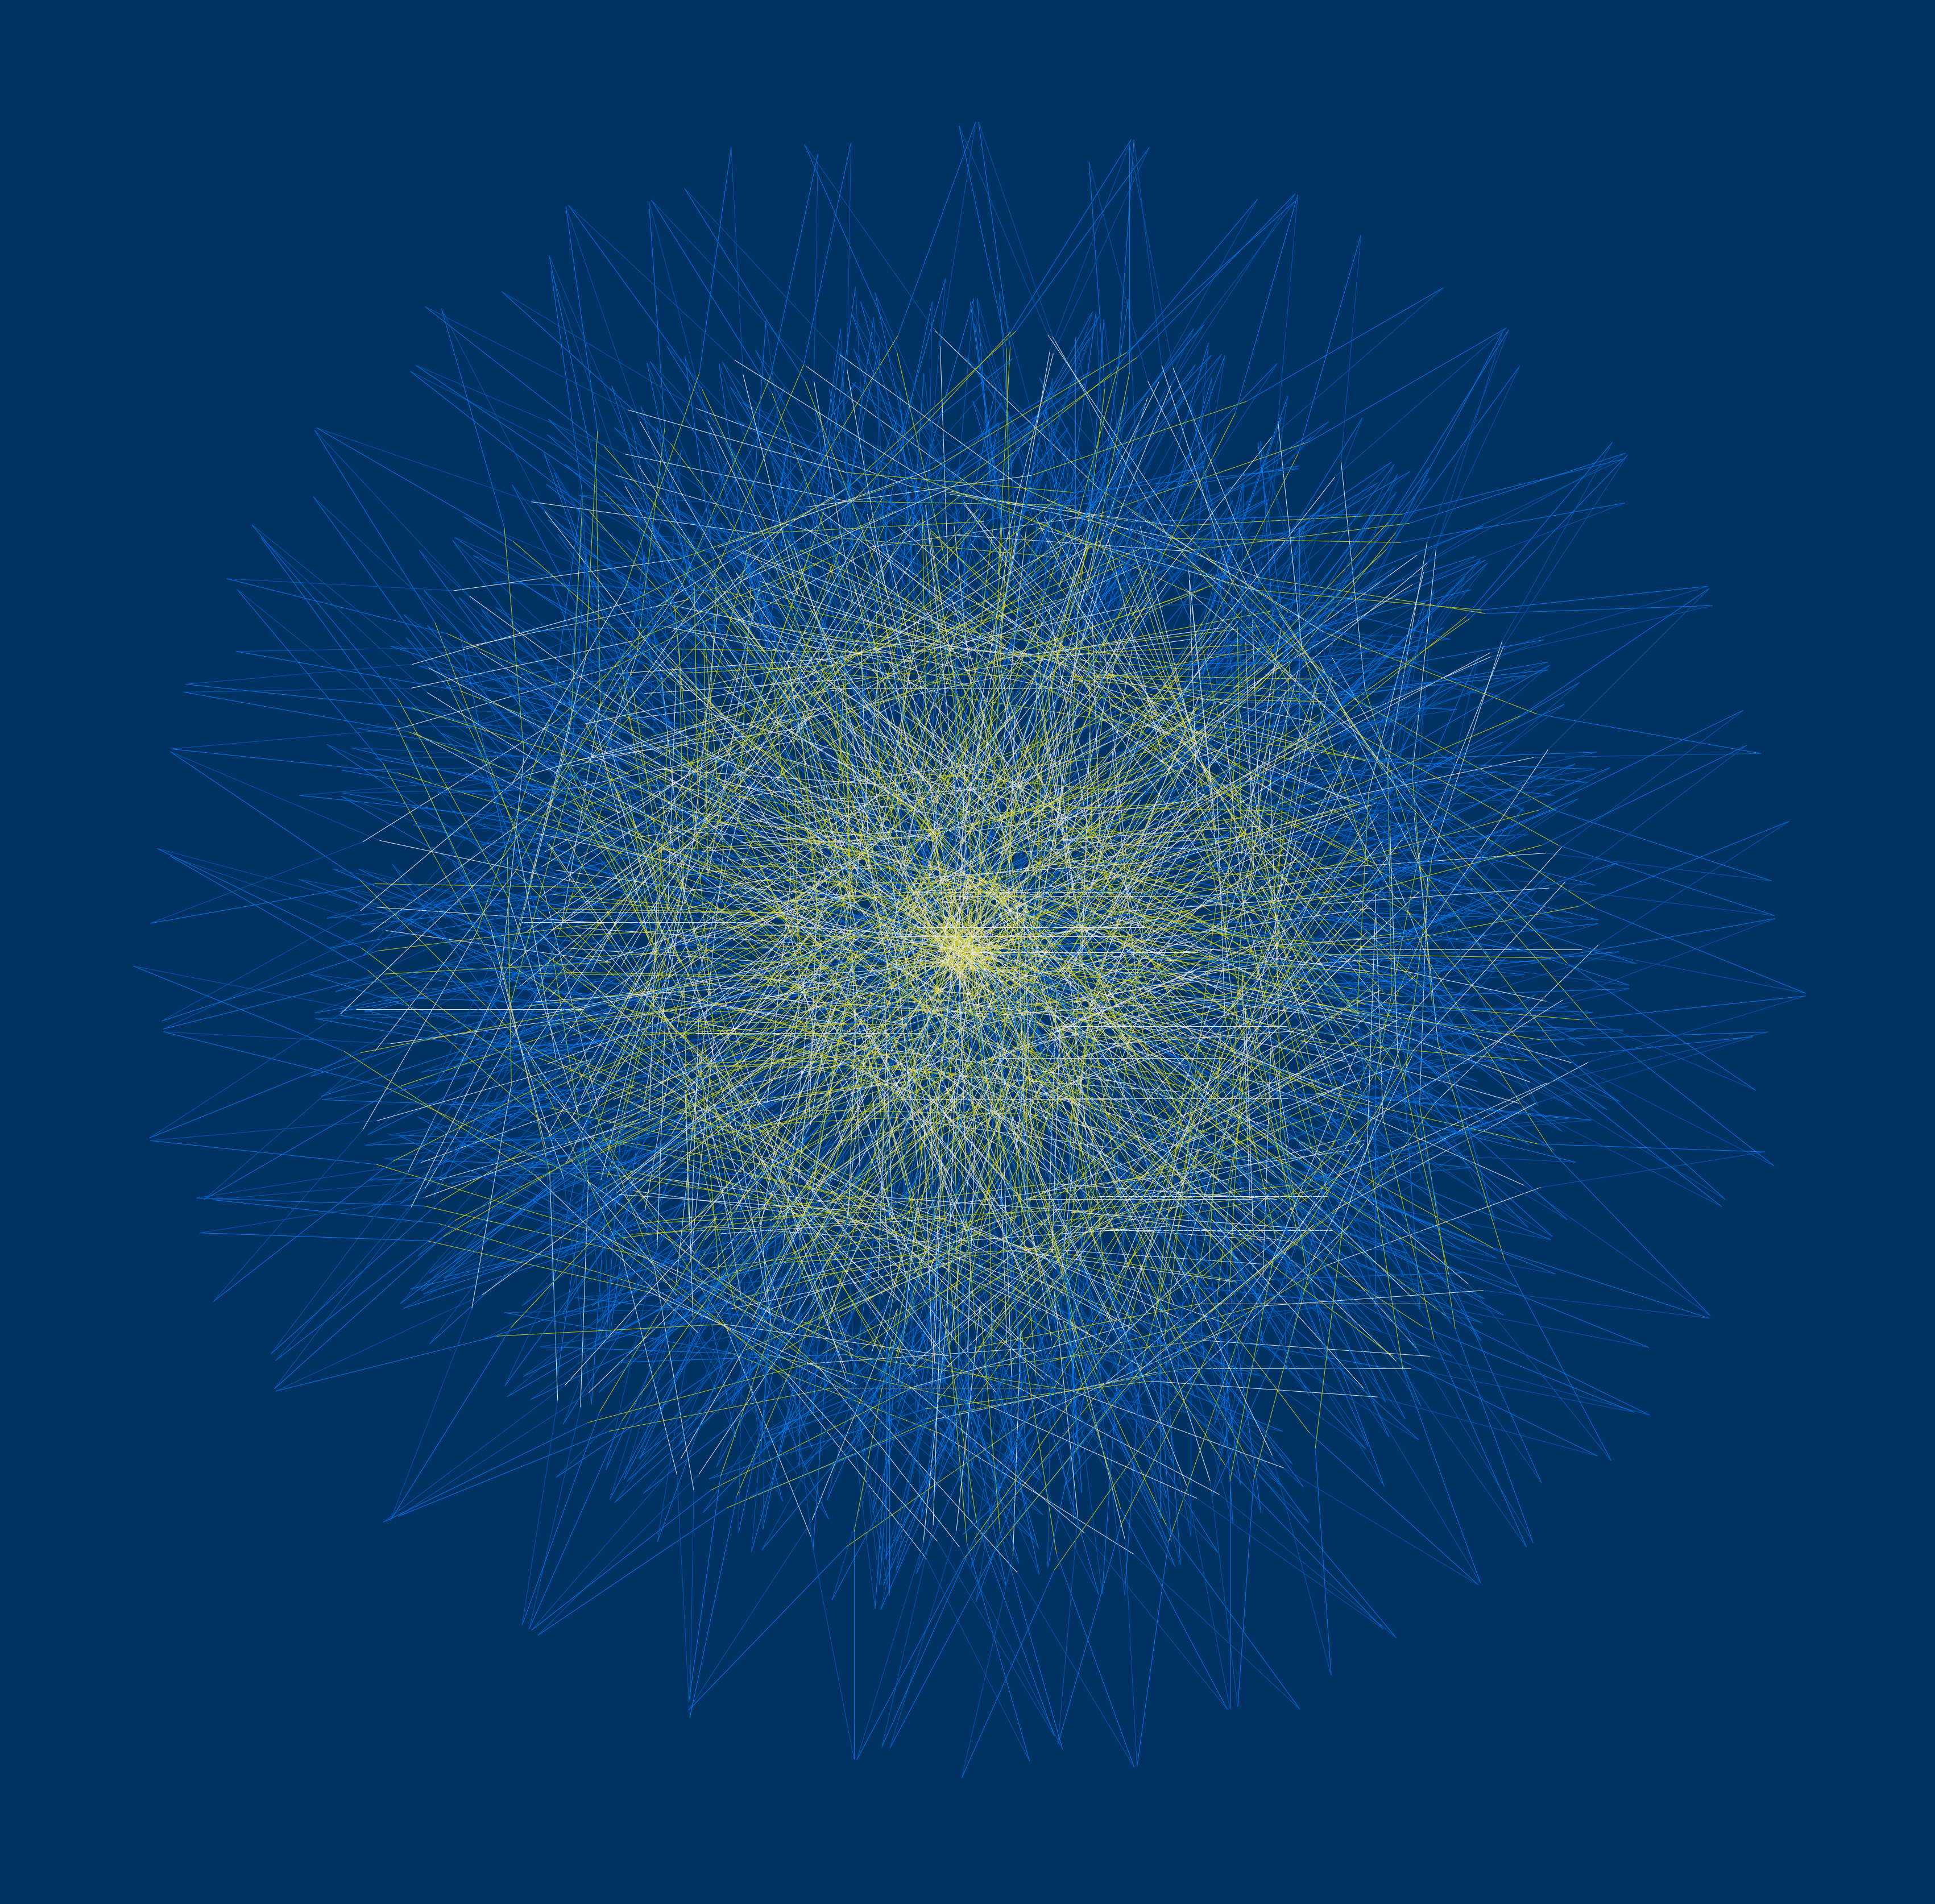
If I hadn’t made this mistake, I might have never looked at this pair of angles, and never created this image. So in my mind, this wasn’t really a “mistake,” but rather a temporary diversion along an equally interesting path.
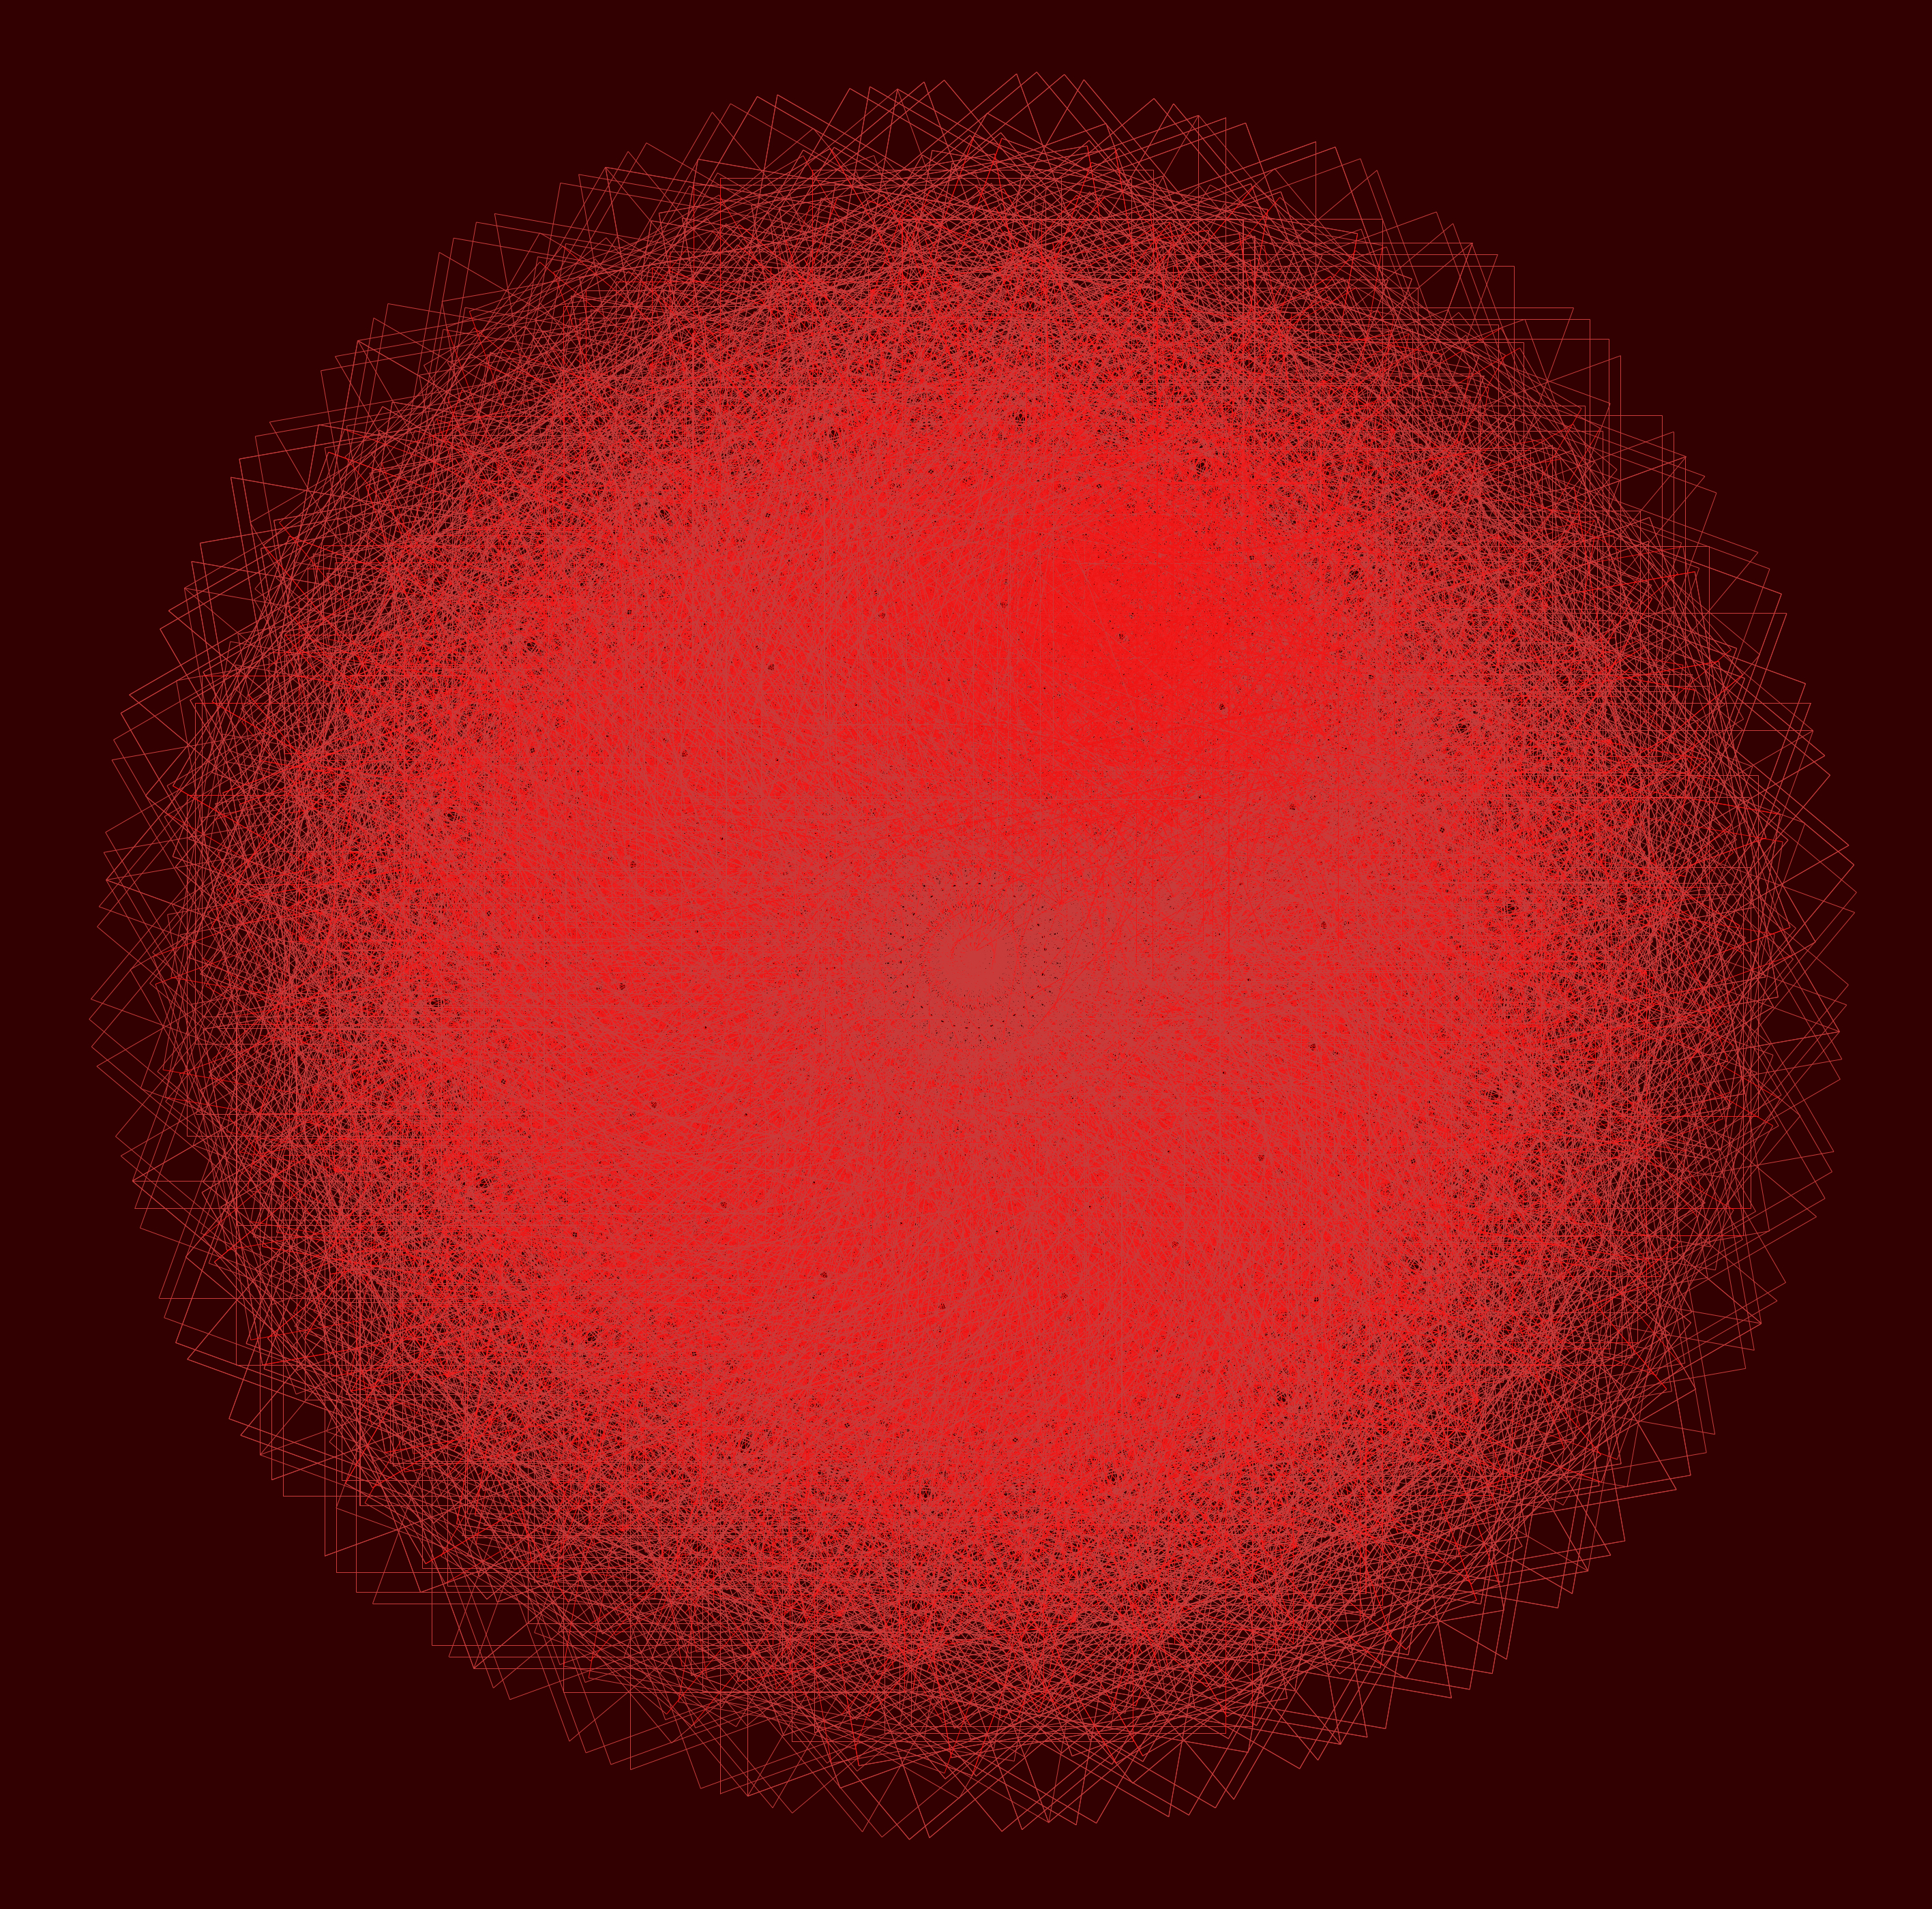
I’ve been posting images regularly to my Twitter feed, @cre8math. I haven’t even touched on the aesthetic qualities of these images — but suffice it to say that it has been a wonderful challenge to create interesting textures and color effects for a particular pair of angles. Frankly, I am still amazed that such a simple algorithm — changing the two angle parameters used to create the Koch snowflake — produces such a wide range of intriguing mathematical and artistic objects. You can be sure that I’m not finished exploring this amazing fractal world quite yet….