It has been some time since an On Coding installment, and I thought it finally time to discuss computer graphics. Of course I’ve done that a lot already, as far as several applications go. For this post, I asked myself something different: what do I use computer graphics for?
I had never really taken a step back to look at the larger picture, but that’s one of the purposes of this thread. I came up with seven major uses, in roughly chronological order from when I started using graphics in each way:
- Creating fractals.
- Graphic design.
- Rendering polyhedra in three dimensions.
- Mathematical illustration.
- Web design.
- Mathematical art.
- Research.
Today, I’ll give a brief overview, and follow up in future posts with more details about the various platforms I’ve used.
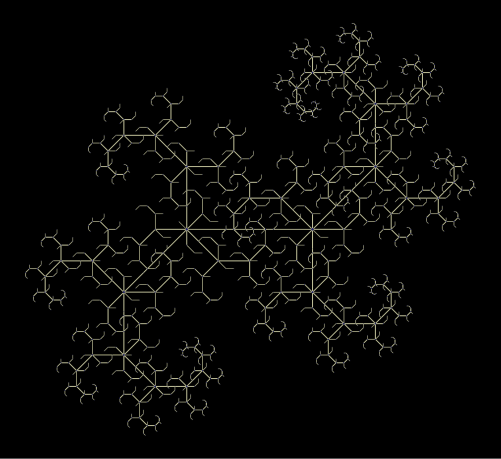
I don’t need to say a lot about the first two uses, since I’ve discussed them in some detail in my posts on Postscript and iterated function systems. My interest in fractals has of course continued, especially given my passion for Koch curves and binary trees. I work less with graphic design now — I used to design stationery and business cards for myself and friends, but now that communication is so largely electronic, there is less of a need. But I do still occasionally design business cards using my art logo, print them onto cardstock, and cut them myself when I need to.
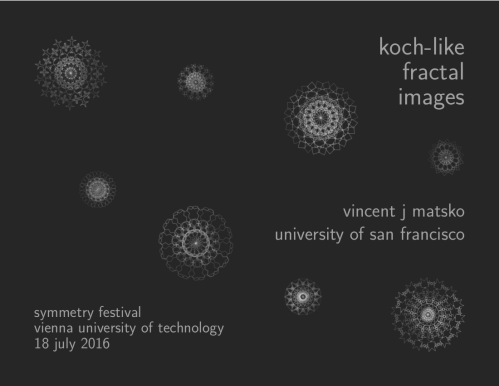
I also spend quite a bit of time designing title and separator slides for presentations. (I frankly admit to never having created a PowerPoint presentation in my entire life. Yuck.) I now exclusively use TikZ in LaTeX since you have complete control over the graphics environment.
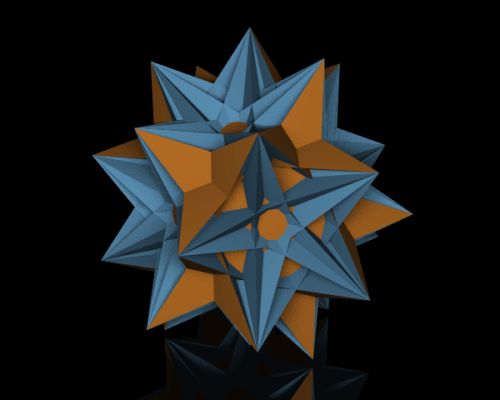
I haven’t mentioned polyhedra extensively on my blog so far, but my interest in three-dimensional geometry goes back to my undergraduate days. When I started teaching college for the first time, I designed (and eventually wrote a textbook for) a course on polyhedra based on spherical trigonometry.
The main tool I used early on was Mathematica, and when I redid all my graphics for my textbook about five years ago, I used Mathematica. The image you see above was rendered using POV-Ray, a ray-tracing package which allows the user to specify a wide range of parameters to create realistic effects. You can see shadows and a reflection as if the polyhedron were sitting on a shiny, black surface. And while the images generated by POV-Ray are quite a bit nicer than those created with Mathematica, they take more time and effort to create.
Mathematical illustration covers a wide range of uses. Drawing figures for a mathematical paper perhaps first comes to mind. I used a package called PSTricks for quite a while (since the “PS” stands for Postscript), but once I learned about TikZ, I changed over fairly quickly. This means I needed to re-render many older graphics (especially in my textbook) — but since for both packages you need precise coordinates, I already had all the mathematics worked out for the PSTricks function calls. So converting to TikZ wasn’t all that problematic. I will be talking in more detail about TikZ in a future post.
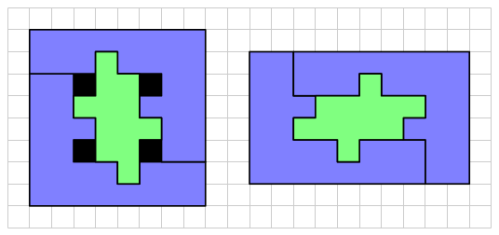
Of course there are also geometrical puzzles and problems, as I’ve discussed before on my blog. Nicely formatted graphics go a long way in making a puzzle appealing to the reader.
Web design is especially important, since I rely so much on my website for everything. I have a web page for my artwork, for my publications, talks, and anything I do professionally. I strive for functionality and aesthetics. I’m also a minimalist as far as design goes — “less is more.”
Also important is ease of use for me. It’s not hard to add something to my homepage. I don’t have the time (or interest) in redesigning my homepage every I want to add a new link. I’m not a fan of hiding everything in dropdown menus — I want the user to glance at my site, and immediately click on the relevant link without having to pore through menus.
Mathematical art has actually been a fairly recent use of computer graphics for me — I only really started getting into it about four years ago. I don’t feel I have to say a lot about it right here, since it is a common thread throughout so many of my posts. You can visit my art website, or look at my Twitter, where I try to update daily (as much as I can) with new and interesting pieces of mathematical art.
Finally, I’d like to say a word about the last use of computer graphics: research. I think this is extremely important, especially with the exploding world of data visualization. Really, this has been perhaps Nick’s and my most important tool when it comes to studying binary trees.
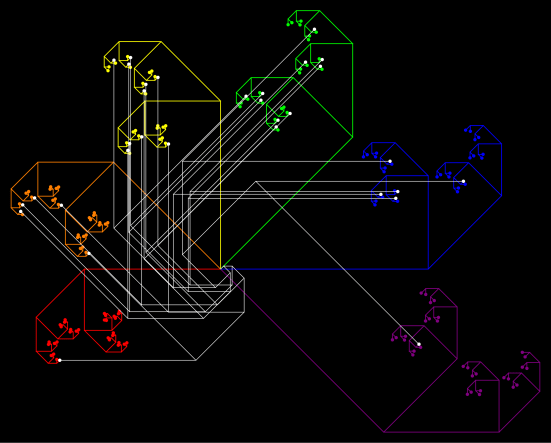
Without going into too much detail about this image, is consists of six scaled and rotated copies of one tree (the ones in color) and a related dual tree (in white). Now count the number of leaves (ends of paths) in common with the colorful trees — and you’ll count 1, 5, 10, 10, 5, and 1. These are, of course, binomial coefficients: row 5 of Pascal’s triangle.
Why is this the case? And is there some general result to be proved? The point I’m making is that when Nick and I create routines to display different trees or combinations of trees, we look at lots of examples, and seek recurring themes.
We learn a lot by doing this, and the direction of our research is heavily influenced by what we observe. This might not be so surprising, since after all, fractal trees are such geometrical objects. I can honestly say the pace of our progress in making conjectures is directly linked to our ability to produce large numbers of trees and knowing what to look for.
So that’s what I use computer graphics for! In future posts, I’ll discuss the various software packages I use, and try to give some idea of the advantages and disadvantages of each. I’ll give special emphasis to those that are open-source — there is so much out there that is free to download, anyone interesting in computer graphics will have no difficulty finding something interesting to experiment with!

One thought on “On Coding IX: Computer Graphics I”