Recall that at the end of Week 4, we had just begun a lab on affine transformations and iterated function systems. At the beginning of Week 5 (Day 11), students were supposed to finish the exercise they began on Friday, and try another. This was the new prompt: Create a fractal using two affine transformations. For the first, rotate by 60 degrees, then scale the x by 0.6 and the y by 0.5. For the second transformation, rotate 60 degrees clockwise, scale the x by 0.5 and the y by 0.6, and then move to the right 1. I provided a link to the fractal which should be produced, shown below.
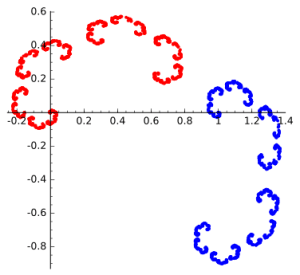
Again, this proved to be a challenge! The reason is that the computer is somewhat unforgiving. To produce the image above, every calculation has to be correct. Here were some common issues:
- There was difficulty interpreting the statements as geometric transformations. In particular, getting the order of the matrix multiplication correct, and interpreting a clockwise rotation as a rotation by -60 degrees.
- Performing the matrix multiplication correctly. Some students were using online calculators, and some had trouble with converting degrees to radians.
- Translating the results into Python code; the affine transformations needed to be converted to the form

I also gave them an exercise to reproduce one of the fractals they needed to analyze for homework the previous week.
This occupied us for all of Week 5, since I also wanted to give them time to work on their upcoming assignment.
Week 6 was our first Presentation Week. Since we’d only need two days for the presentations given the class size, I spent the first day of the week giving my Bridges talk on producing Koch-like fractal images.
The class was interested to learn more about this algorithm, and I had hoped to spend a week devoted to the topic. But because of the Processing work we’ll be doing later — animation of fractals using iterated function systems — I didn’t want to rush through the preliminary work on affine transformations and IFS. Any misunderstandings now would surely be problematic later.
The presentations were to be on papers from the Bridges archives. All papers since the Bridges conferences began (which was in 1998) are archived online. The assignment was simple: find a paper in the archive that’s at least four pages long, and give a five-minute presentation on it to the class. I did create a discussion board where they posted the title/author of their selections so there wouldn’t be any duplicate presentations.
These presentations went very well. Most students’ presentations were close to ten minutes long, and the enthusiasm for their presentations was quite evident. I must admit that I learned a lot, too — I had not read most of the papers they selected.
I had students do simple peer evaluations, and included the item “I would like to learn more about this topic after hearing the presentation.” They selected a number from 1–5, with 5 meaning “most interested.” The overall average score was about 3.9 — meaning the papers piqued their curiosity. In addition, I wanted to get additional ideas about what to include in the few days I set aside for special topics at the end of the semester, or what new ideas to incorporate into next semester’s class.
The most popular paper (4.75 average) was On Generating Dot Paintings in the Style of Howard Arkley, which Madison said reminded her of some of the textures we created during a few of our lab sessions. The next highest average was 4.25, so this was the clear favorite. I hope we’ll have time to explore it further later on.
And that took us to the end of Week 6! I had hoped to have some time in the lab to have students find interesting polyhedra nets they’d like to build, since the next two weeks will be devoted to polyhedra. No, it’s not really a digital art topic — but it is an area of expertise. I wanted students to have some exposure to three-dimensional geometry since if they continue to study computer graphics, they will certainly move from two into three dimensions.
Now it’s time to look at some student work! I’ll focus on one fractal from the assignment on iterated functions systems. Here is the prompt: Create a morphed Sierpinski triangle, based on the code in the Sage worksheet. The idea is to have your fractal look like it was derived from a Sierpinski triangle, but just barely. Someone looking at it should wonder about it, and maybe after 30 seconds or so, say “Hey, that looks like a Sierpinski triangle!”
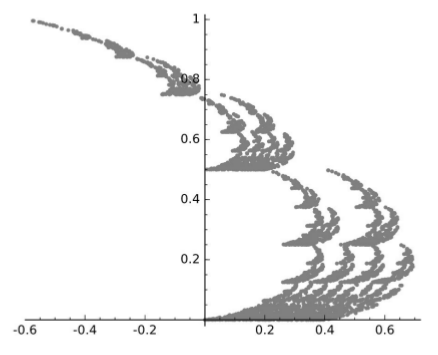
One student created the following image, and wrote:
I think this fractal looks like many sets of pine trees, and I like the way that it shears out. I made the whole thing the same color (gray) to make the fact that it was derived from the Sierpinski triangle less obvious.
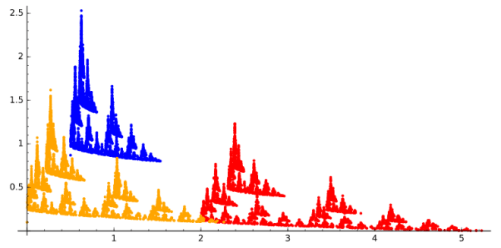
Julia creating the following fractal image, and remarked that at one point, she went “too far” and had to backtrack a bit.
Safina went a different direction, and created this.
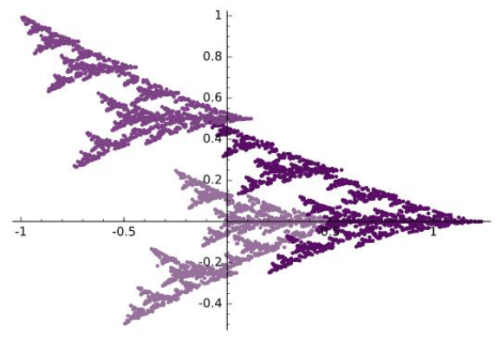
She wrote,
The stretch and rotation reminds me of a tree, more specifically a Christmas tree….I wanted to emulate a sort of Christmas feel because I was listening to Christmas music.
So motivation can come from anywhere! I’ll post more of their images on my Twitter feed, @cre8math.
Again, you can see how my students are really embracing the course and being very creative with the assignments. I’m looking forward to seeing more of their work.
I just assigned a brief response paper asking students how they felt about the course so far, and how it has changed their ideas about art, mathematics, and computer science. I’ll report on their comments in my next summary in two weeks. Stay tuned!

One thought on “Digital Art III: End of Week 6”