Digital Art II: End of Week 4

It’s hard to believe it’s been four weeks already!  Recall that we ended Week 2 with work on an Evaporation piece.  We’ll see examples of student work after a brief recap of Weeks 3 and 4 (Days 6–10).

In the past two weeks, we focused on affine transformations and their use in creating fractals with iterated function systems.  This was not intended to be a deep discussion of linear algebra, but a practical one — how affine transformations reflect the geomtetry of fractal images.

Beetle2
Fractal beetle created with an iterated function system.

Days 6 and 7 were an introduction to the geometry of affine transformations.  I like to emphasize the geometry first, so I worked to find a way to simply and unambiguously describe an affine transformation geometrically.

affinetransformation

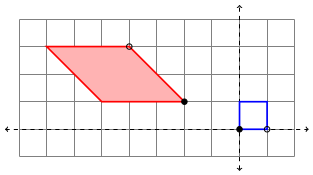
The blue square represents the unit square, and the red parallelogram the transformed square.  The filled-in/open black circles on the parallelogram represent how (0,0) and (1,0) are transformed, respectively.  Additionally, the pink fill in the parallelogram represents that fact that there is a flip (that is, the determinant of the linear part of the transformation is negative).  Strictly speaking, this coloring isn’t necessary, but I think it helps.

We then worked on writing the affine transformation in the form

T\left(\begin{matrix}x\\y\end{matrix}\right)=\left[\begin{matrix}a&b\\c&d\end{matrix}\right]\left(\begin{matrix}x\\y\end{matrix}\right)+\left(\begin{matrix}e\\f\end{matrix}\right)

We did this in the usual way, where the columns of the matrix represent where the unit basis vectors are transformed, and the vector added at the end is the translation from the origin.  These can all be read from the diagram, so that the picture above describes the affine transformation

T\left(\begin{matrix}x\\y\end{matrix}\right)=\left[\begin{matrix}-2&-3\\2&0\end{matrix}\right]\left(\begin{matrix}x\\y\end{matrix}\right)+\left(\begin{matrix}-2\\1\end{matrix}\right).

To help in visualizing this in general, I also wrote a Sage worksheet which produces diagrams like the above picture given the parameters af.  In addition, I showed how the vertices of the parallelogram may be found algebraically by using the transformation itself, so this meant we could look at affine transformations geometrically and algebraically, as well as with the Sage worksheet.   (Recall that all worksheets/assignments may be found on the corresponding day on the course website.  In addition, I have included the LaTeX code for the assignments for those interested.)

I explained several different types of affine transformations — translations, reflections, scalings, and shears.  On Day 8, we saw how to write the affine transformations which describe the Sierpinski triangle, and students got to play with creating their own fractals using the accompanying Sage worksheet.

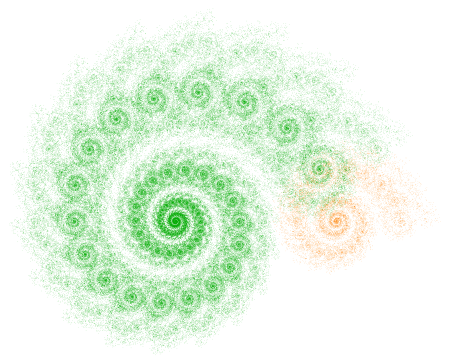
On Day 9, I took about half the class to go through three of my blog posts on iterated function systems.  I emphasized the first spiral fractal discussed on Day035, paying particular attention to the rotation involved and matrix multiplication.

Two2

Most students weren’t familiar with trigonometry (recall the course has no prerequisites), so I just told them the formula for rotation matrices.  We briefly discussed matrix multiplication as function composition.  I gave them homework which involved some practice with the algebra of matrix multiplication.

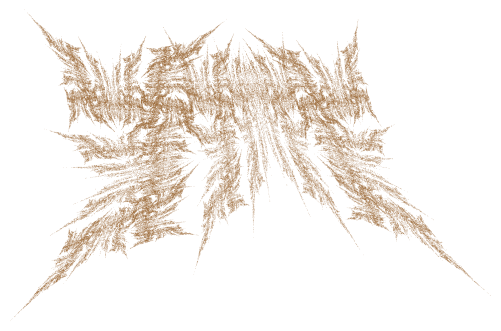
On Day 10, we began with going over some previous homework, and then looked at what transformations were needed to producing the fractal below (as practice for their upcoming homework).

revsierpinski4

We then engaged in the following laboratory exercise:  Create a fractal using two affine transformations.  For the first, rotate by 45 degrees, then scale the x by 0.6 and the y by 0.4, and finally move to the right 1.  For the second transformation, rotate 90 degrees clockwise, and then move up 1.

This was practice in going from a geometrical description to a fractal — they needed to perform the appropriate calculations, and then enter the data in the Sage worksheet and see if their fractal was correct (I gave them a link to the final image).

This turned out to be very challenging, as they were just getting familiar with rotations and matrix multiplication.  So we’ll need to finish during the next class.  I’ll also give them another similar lab exercise during the next class to make sure they’ve got it.

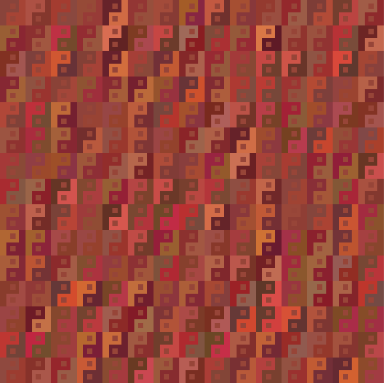
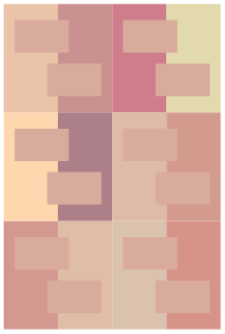
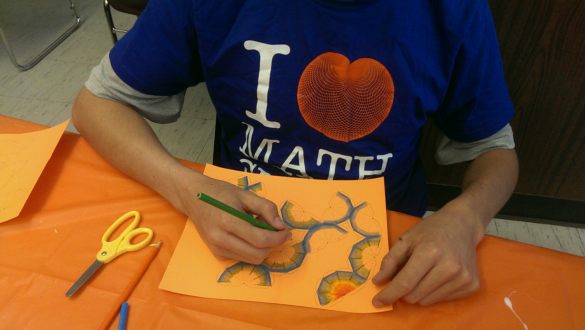
Last week’s digital art assignment was another success!  Again, I was very pleased with how creative my students were.  If you look back at the Sage worksheets, you’ll see that the class was working with color, texture, and color gradients (like my Evaporation piece).

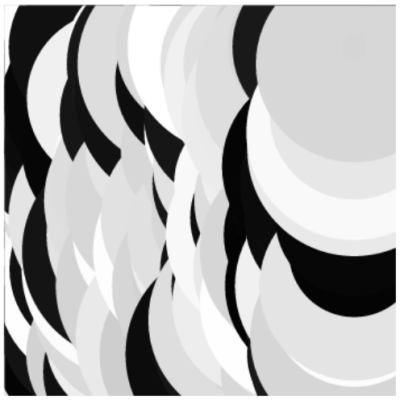
One student created a texture with a lot of movement by keeping the circles separate and using a wide range of gray tones.

af_1

Maddie took advantage of the fact that the algorithm draws the circles in a particular order to create a scalloped texture.  This happens when the circles are particularly large, since the circles are drawn in a linear fashion, creating successive overlap.

mc_2

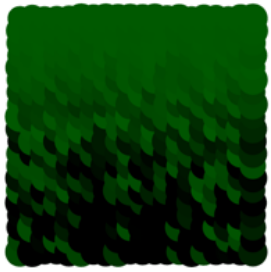
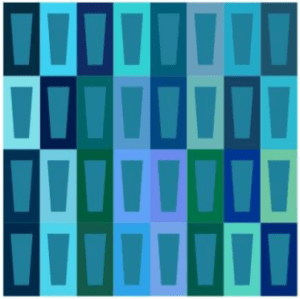
Another student also used this overlapping feature with a color gradient.  He describes his piece as follows:

This piece is what I like to call “The Hedge” as it reminds me a lot of those tall square hedges that are in mansions. It’s as if the light is hitting the top of the hedge and dispersing down into the shadows and thickness of the leaves. I especially like the leafy effect the overlapping circles give.

la_1

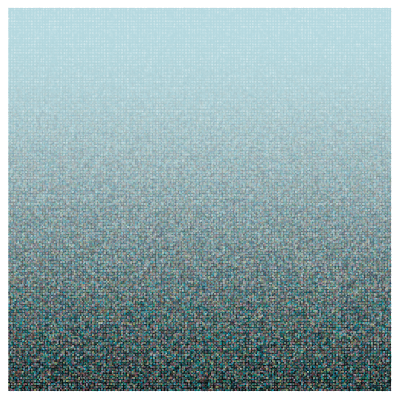
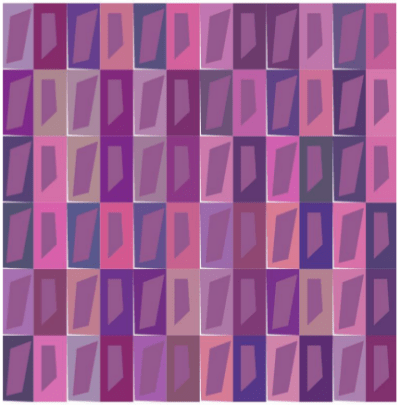
Finally, Madison experimented with altering the dimensions of the grid to create a different feel.

mj_1

She thought that making the image wider made the evaporation effect more pronounced.

These are just some examples of how students in my Mathematics and Digital Art course take ideas I give them and make them their own.  They are always asking how they can incorporate one effect or another into their work, and Nick and I are glad to oblige by helping out with a little code.

As I strive to keep my posts a consistent length, I won’t be able to share all the images I’d like to this week.  So I’ll be posting additional images on my Twitter feed, @cre8math.  Follow along if you’d like to see more!

On Coding I

If you’ve been following along for a while, you’re well aware of my passion for coding.  I firmly believe that all students should learn basic programming in at least one language, if not more.  My hope is that by seeing how the computer may be used to create digital art, some readers will embark on a lifelong coding journey.

To help put this in perspective, I thought I’d share my personal coding journey.  I’d never thought about my programming experience in chronological order before, and realized that talking about my journey could help others on theirs.

My particular journey began during my senior year of high school.  Here was state-of-the-art technology at the time:

352px-TI-30_LED.png
Photo by D. Meyer, Wikipedia Commons.

This was new technology.  Complete with LED display.  I still remember a game I’d play.  It’s maybe not as amusing now as it was then…but take your TI-30, and multiply the numbers 96, 169, 13, and 337.  Then add 1.  Turn your calculator upside-down — and it spells “Shell Oil”!  This is the only one I can remember, but I’m sure I must’ve made up a few more.  (OK, I didn’t remember all the numbers, but I did remember the 96 and 169, and easily figured out the other two.)

You might be wondering — if the hand-held calculator didn’t come out until my senior year, what did we do before that?  Well, we learned trigonometry using tables of numbers.  If we needed a value which wasn’t in the tables, we figured it out using linear interpolation.  Same with logarithms, and any other numerical calculation.  Tables, pencil, paper.  Try to imagine it!

There wasn’t anything in the way of personal computers then, either.  That’s why I think novice programmers today have it so easy!  Download Python, and ask the internet how to do stuff.  No problem.

When I was a senior in high school, some of us took a bus to a local university to learn Fortran.  (Though not the most common computer language today, it is widely used in disciplines such as physics because of its speed in doing numerical calculations.)  There were no computers in high schools.

And get this.  We used punch cards.  Which looked like this:

Blue-punch-card-front-horiz.png
Photo by Gwern, Wikipedia Commons.

You needed one card for each line of code you wrote, which you created on a sort of typewriter.  Then you put your cards in a stack, and took them over to the card reader.  Your cards were read, your program was executed, and after a few moments, you got a printout of what you told the computer to do.

Now this line of code took about 10-15 seconds to type in Sage, and printed out the numbers from 1 to 10 on my screen:

for i in range(10):  print i+1

No getting on a bus, punching cards, etc.  It’s truly amazing how far technology has progressed since those years, and also very wonderful that learning basic programming is so easy now.

I remember really enjoying the way you had to think in order to write computer programs. So when I went to college, I took a programming course in PASCAL my very first semester. Carnegie Mellon was on the forefront of what is now called “computer science,” but at the time, it was not a well-established discipline.  In fact, when I was an undergraduate, you couldn’t be a computer science major — you had to be an applied math major in the computer science track!  Of course that’s all changed now.

Naturally I enjoyed this course, too.  Like Fortran, PASCAL is a procedural programming language — in other words, you’re essentially writing procedures and routines that execute statements in a particular order.  It was probably the most popular procedural language before C came along.  There are other types of computer languages as well, and we’ll get to them when they appear in the chronology.

I took two other computer courses which also used PASCAL, and liked them, too.  These courses were more intense and involved using a lot of data structures, such as arrays, linked lists, binary trees, etc.  But again, in the days before PCs.

So to do your assignment, you had to go to a computer lab.  Then sit down in front of one of these.

Heathkit_computer_H88.jpg
Photo by Arthur G Korwin Piotrwoski, in the Wikipedia Commons.

And no — there was no mouse, no touch-screen, no windows — just a keyboard you used to type lines of text on a TV-like screen.  And no — it’s not even a computer!  It’s a terminal.  What that means is that there was just one large computer, called the main frame, with many terminals linked to it.  When you wanted to run your program, you had to get in the queue — the main frame could only compile one program at a time.  Then the output would be printed to your screen.

I still remember my first (and last!) all-nighter finishing a programming assignment.  I put it off, and waited until the night before.  And so did a lot of other people.

What that meant was the queue was long.  So you had to wait — maybe 15 minutes or so — for your turn.  This was for just executing your program once.

If you made a spelling mistake — say typed “BEING” instead of “BEGIN,” which I do now and then when I’m typing fast — you waited 15 more minutes to try again.  A short program which might only 20 minutes to complete when the main frame wasn’t so busy took several hours….  I will say I never did that again!  I learned my lesson.

So know you see why I think it’s so easy to learn programming today!  And why all students should….

There’s lots more to the story, and I’ll come back to it now and again.  It’s been fun thinking about those days of emerging technology!

Digital Art I: End of Week 2

Mathematics and Digital Art is well underway!  As promised, I’ll be giving weekly or biweekly summaries of how things are going.  You’re also welcome to follow along on the course website.

Day 1 was the usual introductory class, with a discussion about the syllabus and what the course would be like.  (Remember I blogged a four-part series on the course beginning at Day045.)  I wanted to make it clear that there would be both mathematics and coding in the course.  Some students ended up dropping the course the first week as a result, leaving the class with nine students.

On Day 2, I discussed representing color on the computer — using RGB values (both integer and real), as well as using hexadecimal notation.  Since the course has no prerequisites, we really did need to start at the beginning.  Students did some exploring with various RGB values using a Sage worksheet.  (Links to all the worksheets and other websites referenced in class can be found on the course website.)

Josef Albers was the topic of Day 3.  I’ve talked a lot about his work before, so I won’t go into great detail here.  I let students try out a Sage worksheet — they had an assignment to create their own version which was due in about week, so we spent half the class starting the project.

Day002Albers6Web3

Essentially, they needed to choose a color scheme and size for their piece.  But then they needed to use five different random number seeds, and decide which of the five resulting images looked best to them, and why.  So the assignment included a brief narrative as well.  The complete prompt is on my website.  (And I think I’ll just stop saying this — just know that anything I mention in these posts will be discussed in more detail on the course website.)

The next two classes focused on creating a piece based on Evaporation.

Day011Evaporation2bWeb

Again, I discussed this in some detail before (Day011 and Day012).  The basic idea is to use randomness to create texture, both with color and geometry.  Add to this the idea of a color gradient, and that’s enough to get started.

I took a bit of time on Day 5 to explain in some detail about how to create color gradients using a function like y=x^p, where p>0 — it isn’t exactly obvious if you’ve never done it before.  Having Nick as my TA in the class really helped out — I was at the board, and he was at the computer drawing graphs of functions and varying the parameters in the routine to produce color gradients. We worked well together.

It turns out that having two of us in the computer lab is really great — debugging takes time.  Students are gradually getting accustomed to the Sage environment, and  learning to go back and redefine functions if they get an error message indicating that something is undefined….

I have really been enjoying the laboratory experience!  My students are wonderfully creative, taking the basic motifs in directions I hadn’t considered.  I’ll illustrate with a few examples from the first assignment.  In this post and future posts, all work is presented with the permisson of the student, including the use of his/her name if applicable.

I should also remark that my intent is not merely to post pieces I subjectively like.  True to the title of my blog, Creativity in Mathematics, I intend to illustrate creative, original ideas.  I may feel that some students have been more successful with their ideas than others — but I’ll share that with the students individually rather than discuss it here.

In order to talk about the students’ creativity, however, let me show you the image they started with.sample

Andrew experimented with minimalism, creating a series of 2 x 2 images.  This is the one he said he liked the best because of the symmetry and contrast.

AQ_1

Julia was interested in exploring different geometries and created a few drafts which deviated from the rectangle-within-rectangle motif.  Here is one of them.

JN_1

Safina took a slightly different approach.  She wanted to create some variation by using trapezoids in the centers of the larger rectangles.

SM_1

Ella really worked with the geometry, creating a lot of visual contrast — especially with the asymmetrical polygons.

EK_1

So we’re off to a great beginning!  Right now, Nick and I are having to help a lot with editing code since it’s a new experience for most students.  But they are eager to learn, and as you can see, willing to explore new ideas, going well beyond where they started.  We can look forward to a lot more interesting work as the semester progresses!

P.S.  If you are ever interested in any of the students’ work and would like to discuss it further, send an email to vjmatsko@usfca.edu and I’ll forward it on to them!

Bridges: Mathematics and Art II

As I mentioned in my first post about Bridges 2016 (see Day038), one of my students, Nick, had artwork and a short paper accepted, and also received a $1000 travel scholarship! This week, I’d like to share his work with you. His paper is called Polygon Spirals. Here is the abstract (all quotes are taken directly from Nick’s paper):

Logarithmic spirals may be classically constructed with a chain of similar triangles that share the same center of similitude. We extend this construction to chains of n-
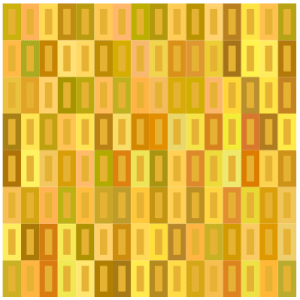
gons with centers on a logarithmic spiral with turning angle \pi/n, and scale factors with interesting properties. Finally, polygon spirals of this kind are used to produce a variety of artistic images.

I first learned of Nick’s interest in this type of spiral when he was in my Calculus II class, where he introduced a similar idea for his Original Problem assignment (see Day013). I encouraged him to continue with this project and submit his work to Bridges 2016. Here is Nick’s motivation in his own words:

The investigation of polygon spirals began by studying curves that arise when regular polygons with an odd number of sides are strung together. When polygons are strung together into a band by gluing them together along their sides, then the choice of what subsequent edge pairs are being used will define a turning angle introduced at each joint. In this paper we focus on bands made with minimal turning angles and with a consistent turning direction. Each odd n-gon defines its own turning angle, \pi / n. Moreover, by introducing a constant scale factor that modifies each subsequent polygon, a large variety of logarithmic spirals can be generated.

logarithmicpentagons
Figure 1: Logarithmic construction on pentagons
nestingarms
Figure 2: Spirals in phase

My original inspiration came from observing spirals of opposite handedness emerging from adjacent faces of the same polygon. The natural question that arose was which ratio to pick so that the two polygon chains would fall in phase, as in Figure 2. In other words, I needed to find the ratio such that every crossing point of the two logarithmic spirals coincided with the center of a polygon along each band. In this case, the two bands would share a polygon every period. I found this to be achieved when the golden ratio was applied to pentagons, which spurred a determination of the analogous ratio for generalized n-gons that corresponds to the sharing of every n^{\rm th} polygon. The construction hinges on similar triangles whose vertices are the center of a polygon, the center of one of that polygon’s children, and the center of similitude.

spiral
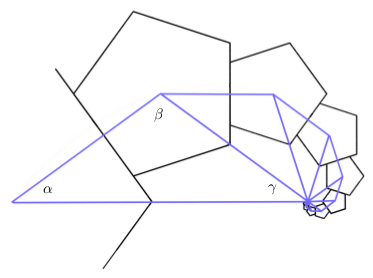
Figure 3: Logarithmic similar triangles

Referring to Figure3 (illustrated in the case n=5), \alpha=\pi/n and \beta=3\pi/n, so that \gamma=\pi/n. Now the triangle with angles labelled \alpha, \beta, and \gamma is isosceles because \alpha = \gamma. Moreover, the ratio between the longer and shorter sides is the same for all triangles since the spiral is logarithmic. If the shorter sides are of unit length, half of the base is \cos (\pi/n), making the base, and thus the ratio, equal to 2\cos (\pi/n).

Once the ratio has been found, spirals can be nested by applying a rotation of \pi/n. Completing this process yields n nested n-gon spirals.

With the ratio found above, it is not hard to show that the equation for one of the logarithmic spirals with this ratio, passing through the centers of the n-gons, has the equation:

r = (2\cos (\pi/n)) ^{n \theta/{\pi}}.

heptagons
Figure 4: Heptagon spiral

With most Bridges papers, there is a mix of mathematics and art. In fact, the first criterion listed on the Bridges website for art submissions is “Math content (this is a mathematically sophisticated audience.)” The second is “Esthetic appeal,” so artistry is important, too. What follows is Nick’s discussion of how he used the mathematical ideas discussed above to create digital art.

art3
Figure 5: Pentagon arms

Begin with a base polygon, and consider producing spirals from every face at every iteration. Although this would create too dense a pattern, it is possible to produce an interesting subset of this set of polygons using a random algorithm. This algorithm assigns a probability that a spiral is generated from each face of the n-gon, and this probability is randomly altered and then inherited by each child. The colors are also inherited and altered every generation. In Figure 5, the detailed texture is actually built of many small pentagons at a deep iteration. Off to the right can be seen a randomly generated pair of pentagonal arms falling into phase.

art1
Figure 6: Nested pentagon tiling

Figure 6 is a tiling of pentagons that features nested rings of pentagons with the property that any two adjacent pentagons differ in size by a ratio of the golden ratio. Figure 7 is an overlay of nonagon spirals with ratios between 0 and 1. This image captures the vast breadth of possible spirals based on a given n-gon, and the fascinating way that they interact.

art2
Figure 7: Nonagon spiral overlay

Figure 8 was randomly generated by the same algorithm which produced Figure 5, however with nonagons rather than pentagons. This picture illustrates the infinite detail of a fractal set based on interacting nonagon spirals.

art4
Figure 8: Nonagon bush

Quite an amazing sequence of images! Nick took a Python programming class his first semester, and so was well-versed in basic coding. As a mathematics major, he had the necessary technical background, and being a double major in art as well helped him with the esthetics.

So yes, it took a lot of work! But the results are well worth it. Nick’s success illustrates what motivated undergraduates can accomplish given the appropriate encouragement and support. Let’s see more undergraduates participate in Bridges 2017!


Mathematics and Digital Art IV

This week will complete the series devoted to a new Mathematics and Digital Art (MDA) course I’ll be teaching for the first time this Fall.  During the semester, I’ll be posting regularly about the course progression for those interested in following along.

Continuing from the previous post, Weeks 7 and 8 will be devoted to polyhedra.  While not really a topic under “digital art,” so much of the art at Bridges and similar conferences is three-dimensional that I think it’s important that students are familiar with a basic three-dimensional geometric vocabulary.

Moreover, I’ve taught laboratory-based courses on polyhedra since the mid 1990’s, and I’ve also written a textbook for such a course.  So there will be no problem coming up with ideas.  Basic topics to cover are the Platonic solids (and proofs that there are only five), Euler’s formula, and building models with paper (including unit origami) and Zometools.

There are also over 50 papers in the Bridges archive on polyhedra.  One particularly interesting one is by Reza Sarhangi about putting patterns on polyhedra (link here).  Looking at this paper will allow an interested student to combine the creation of digital art and the construction of polyhedra.

At the end of Week 7, the proposal for the Final Project will be due.  During Week 8, I’ll have one of the days be devoted to a construction project, which will give me time to go around to students individually and comment on their proposals.

This paves the way for the second half of the semester, which is largely focused on Processing and work on Final Projects.

In Weeks 9 and 10, the first two class periods will be devoted to work on Processing.  I recently completed a six-part series on making movies with Processing (see Day039–Day044), beginning with a very simple example of morphing a dot from one color to another.

These blog posts were written especially for MDA, so we’ll begin our discussion of Processing by working through those posts.  You’ll notice the significant use of IFS, which is why there were such an important emphasis during the first half of the course.  But as mentioned in the post on Day044, the students in my linear algebra course got so excited about the IFS movie project, I’m confident we’ll have a similar experience in MDA.

The third class in Weeks 9 and 10 will be devoted to work on the Final Project.  Not only does taking the class time to work on these projects emphasize their importance, but I get to monitor students’ progress.  Their proposals will include a very rough week-by-week outline of what they want to accomplish, so I’ll use that to help me gauge their progress.

What these work days also allow for is troubleshooting and possibly revising the proposals along the way.  This is an important aspect of any project, as it is not always possible to predict one’s progress — especially when writing code is involved!  But struggling with writing and debugging code is part of the learning process, so students should learn to be comfortable with the occasional bug or syntax error.  And recall that I’ll have my student Nick as an assistant in the classroom, so there will be two of us to help students on these work days.

Week 11 will be another Presentation Week, again largely based on the Bridges archives.  However, I’ll give students more latitude to look at other sources of interest if they want.  Again, we’re looking for breadth here, so students will present papers on topics not covered in class or the first round of presentations.

I wanted to have a week here to break up the second half of the semester a bit.  Students will still include this week in their outline — they will be expected to continue working on their project as well.  But I am hoping that they find these Presentation Weeks interesting and informative.  Rather like a mini-conference in the context of the usual course.

Weeks 12 and 13 will essentially be like Weeks 9 and 10.  Again, given that most students will not have written any code before this course, getting them to make their own movies in Processing will take time.  There is always the potential that we’ll get done with the basics early — but there is no shortage of topics to go into if needed.  But I do want to make sure all students experience some measure of success with making movies in Processing.

Week 14 will be the Final Project Presentation Week.  This is the culminating week of the entire semester, where students showcase what they’ve created during the previous five weeks.  Faculty from mathematics, computer science, art, and design will be invited to these presentations as well.  I plan to have videos made of the presentations so that I can show some highlights on my blog.

Week 15 is reserved for Special Topics.  There are just two days in this last week, which is right before Final Exams.  I want to have a low-key, fun week where we still learn some new ideas about mathematics and art after the hard work is already done.

So that’s Mathematics and Digital Art!  The planning process has been very exciting, and I’m really looking forward to teaching the course this fall.

Just keep the two “big picture” ideas in mind.  First, that students see a real application of mathematics and programming.  Second, students have a positive experience of mathematics — in other words, they have fun doing projects involving mathematics and programming.

I can only hope that the course I’ve designed really does give students such a positive experience.  It really is necessary to bolster the perception of mathematics and computer science in society, and ideally Mathematics and Digital Art will do just that!

Mathematics and Digital Art III

Now that the overall structure of the course is laid out, I’d like to describe the week-by-week sequence of topics.  Keep in mind this may change somewhat when I actually teach the course, but the progression will stay essentially the same.

Week 1 is inspired by the work of Josef Albers (which I discuss on Day002 of this blog).  Students will be introduced to the CMYK and RGB color spaces, and will begin by creating pieces like this:Albers2

We’ll use Python code in the Sage environment (a basic script will be provided), and learn about the use of random number generation to create pattern and texture.  This may be many students’ first exposure to working with code, so we’ll take it slowly.  As with many of the topics we’ll discuss, students will be asked to read the relevant blog post before class.  While we’ll still have to review in class, the idea is to free up as much class time as possible for exploration in the computer lab.

Week 2 will revolve around creating pieces like Evaporation,

Day011Evaporation2bWeb

which I discuss on Day011 and Day012.  Again, we’ll be in the Sage environment (with a script provided).  Here, the ideas to introduce are basic looping constructs in Python, as well as creating a color gradient.

Weeks 3–5 will be all about fractals.  This is an ambitious three weeks, so we’ll begin with iterated function systems (IFS), which I discuss extensively on my blog (see Day034, Day035, and Day036 for an introduction).

Two

The important mathematical concept here is affine transformation, which will likely be unfamiliar to most students.  Sure, they may understand a matrix as an “array of numbers,” but likely do not see a matrix as a representation of a linear transformation.

But there is such a wealth of fascinating images which can be created using affine transformations in an IFS, I think the effort is worth it.  I’ve done something similar with a linear algebra course for computer science majors with some success.

I’ll start with the well-known Sierpinski triangle, and ask students to think about the self-similar nature of this fractal.  While the self-similarity may be simple to explain in words, how would you explain it mathematically?  This (and similar examples) will be used to motivate the need for affine transformations.

In parallel with this, we’ll look at a Python script for creating an IFS.  There is a bit more to this algorithm than the others encountered so far, so we’ll need to look at it carefully, and see where the affine transformations fit in.  I’ll create a “dictionary” of affine transformations for the class, so they can see and learn how the entries of a matrix influence the linear/affine transformations.

Having students understand IFS in these three weeks is the highest priority, since they form the basis of our work with Processing later on in the semester.  As with any course like this, so much depends on the students who are in the course, and their mathematical background knowledge.

With this being said, it may be that most of these weeks will be devoted to affine transformations and IFS.  With whatever time is left over, I’ll be discussing fractal images based on the same algorithm used to produce the Koch curve/snowflake (which I discuss on Day007, Day008, Day009, and Day027).

Day007Starburst

The initial challenge is to get students to understand a recursive algorithm, which is always a challenging new idea, even for computer science majors.  Hopefully the geometric nature of the recursion will help in that regard.

If there is time, we’ll take a brief excursion into number theory.  Without going into too many details (see the blog posts mentioned above for more), choosing angles which allow the algorithm to close up and draw a centrally symmetric figure depends on solving a linear diophantine equation like

ax+by\equiv c\quad ({\rm mod}\ m).

It turns out that the relevant equation may be solved explicitly, yielding whole families of values which produce intricate images.  Here is one I just created last week for a presentation on this topic I’ll be giving at the Symmetry Festival 2016 in Vienna this July:

Koch_336_210_218

There is quite a bit of number theory which goes into setting up and solving this equation, but all at the elementary level.  We’ll just go as far as we have time to.

Week 6 will be the first in a series of three Presentation Weeks.  This week will be devoted to having students select and present a paper or two from the Bridges archive.  This archive contains over 1000 papers given at the Bridges conferences since 1998, and is searchable.

The idea is to expose students to the breadth of the relationship between mathematics and art.  Because of the need to explain both the mathematics and programming behind the images we’ll create in class, there necessarily will be some sacrifice in the breadth of the course content.   Hopefully these brief presentations will remedy this to some extent.

With three 65-minute class periods and 13 students, it shouldn’t be difficult to allow everyone a 10-minute presentation during this week.  It is not expected that a student will understand every detail of a particular paper, but at least communicate the main points.

Presentations will be both peer-evaluated and evaluated by me.  As these are first-year students, it is understood that they may not have given many presentations of this type before.  It is expected that they will improve as the semester progresses.

I realize that some of these ideas are repeated from last week’s post, but I did want to make these two posts covering the week-by-week sequence of topics self-contained.  I also wanted to give enough detail so that anyone considering offering a similar course has a clear idea of what I have in mind.  Next week, we’ll finish the outline, so stay tuned!

Mathematics and Digital Art II

This week, I want to talk more about the overall structure of the Mathematics and Digital Art (MDA) course I’ll be teaching in the fall.  I won’t have time to address specifics about content today, but I’ll begin with that next week.

As I mentioned last week, because I can’t require students to bring a laptop to class, MDA will meet in a computer laboratory.  Here is my actual classroom:

CO214_10182013

Each day, there will be some time in class — usually at least half the 65-minute period — for students to work at their comptuers.  This is a typical 16-week course meeting three times a week.  (Though courses at USF are four credits, hence the longer class time each day.)

Because the course is project-based, there are homework assignments and projects due, but no exams.  There may be an occasional homework quiz on the mathematics, where I let students use their notes.  I prefer this method to collecting homework, since there are always issues of too much copying.  Because I typically change the numbers in homework quiz problems, it is difficult to do well on this type of quiz if all you do is copy your homework from someone else.

Instead of a Final Exam, there is a major project due at the end of the course.  So the first half of the semester — roughly eight weeks — covers a breadth of topics so that students have lots of options when writing a proposal for their Final Project.

Their proposals are due mid-semester, so I have time to evaluate and discuss them, as well as make suggestions.  I try to make sure each project is appropriate for each student — enough to challenge them, but not frustrate them.  Of course there is flexibility for projects to undergo changes along the way, but the proposal allows for a very concrete starting point.

In the second half of the semester, most weeks will include one day for working on Final Projects.  Not only does this emphasize the importance of the projects, but it also lets me see their progress and perhaps alter the direction they’re going if necessary.

The other main focus of the second half of the semester is the use of Processing to make movies.  Because most students will not have studied programming before, I need to make sure there is plenty of time for them to be successful.  We’ll need to take it slowly.

Of course this means that students will not be able to include the use of Processing in their course proposals, but that doesn’t mean they can’t adapt their project along the way to include the use of Processing if they want to.  This is a necessary trade-off, however, since front-loading the course with a discussion of Processing would mean sacrificing the breadth of topics covered.  I like the students to see as much as possible before they write their Final Project proposals.

This is the broad structure of the course.  There are a few other aspects of MDA which also deserve mention.  Three weeks of the course are devoted to presentations.  The idea here is twofold.  First, there is the clear benefit of developing students’ public speaking abilities.

Second, because students will be giving presentations on papers from the Bridges archive (the archive of all papers presented in the Bridges conferences since 1998), they will need to find a paper on a topic of interest to themselves at a level they can understand.  As there are over 1000 papers here, along with an ability to search using keywords, this should not pose a siginificant problem.  Of course should a student have another source about mathematics and art they are keen to share, this would be acceptable as well.

Because the class size is small (13 students), it will feasible to have all students present in each of the three weeks.  The first Presentation Week on Bridges papers will be about the sixth week of the semester, and the second will be about the eleventh week.

The third Presentation Week will be at the fourteenth week of the semester, but this time will be focused on Final Projects.  I will invite mathematics, computer science, and art/design faculty to these presentations as well, and of course will let the students know this in advance.  All presentations will be both peer-evaluated and evaluated by me.

There is also a plan to bring guest speakers from the Bay area into the classroom.  I know a handful of mathematical artists in the area, so bringing in two or three speakers over the course of a semester would be feasible.  This is one of the design features of the First-Year Seminar, incidentally — expose students to the larger San Francicso/Bay area community.

In addition, I can have a student assistant in the classroom as well.  Nick, my student who is also going to the Bridges conference in Finland this year, will serve in that role.  We’ve spent a semester in a directed study to prepare for the Bridges 2016 conference, so he has unique qualifications.  I’ll talk more about Nick in a future post.

When teaching a programming course with a laboratory component, it is difficult to be able to get around to help all students in any given class period.  Certainly some questions students ask have simple answers (as in a syntax fix), but others will require sitting down with a student for several minutes.

So it will be great to have Nick as an assistant, since that will allow two of us to circulate around the classroom during the laboratory part of the class.  The benefit to students will be obvious, and with the small class size, I’m confident they’ll get the attention they need.

Finally, I left the last week (just two class periods) open for special topics.  Given all the demands of a first-semester student just before Final Exam week, I thought it would be nice for them to have a short breather.  I’ll take suggestions for topics from the students, with the Bridges papers they presented on as a good starting point.

So that’s what the course looks like, broadly.  Next week, I’ll begin a week-by-week discussion of the mathematical/artistic content of the course.  I also intend to post weekly or biweekly while the course is going on — course design is a lot easier in theory than in practice, and I’ll be able to share pitfalls and triumphs in real time!


Mathematics and Digital Art I

Last week I discussed a movie project I had my linear algebra students do which involved the animation of fractals generated by  iterated function systems.  This week, I’d like to discuss a new classroom project — a Mathematics and Digital Art course I’ll be teaching this Fall at the University of San Francisco!

The idea came to me during the Fall 2015 semester when we were asked to list courses we’d like to teach for the Fall 2016 semester.  I noticed that one of my colleagues had taught a First-Year Seminar course  — that is, a course with a small enrollment (capped at 16) focused on a topic of special interest to the faculty member teaching the course.  The idea is for each first-year student to get to know one faculty member fairly well, and get acclimated to university life.

So I thought, Why not teach a course on mathematics and art?  My department chair urged me to go for it, and so I drafted a syllabus and started the process going.  Here’s the course description:

What is digital art? It is easy to make a digital image, but what gives it artistic value? This question will be explored in a practical, hands-on way by having students learn how to create their own digital images and movies in a laboratory-style classroom. We will focus on the Sage/Python environment, and learn to use Processing as well. There will be an emphasis on using the computer to create various types of fractal images. No previous programming experience is necessary.

I have two”big picture” motivations in mind.  First, I want the course to show real applications of mathematics and programming.  Too many students have experienced mathematics as completing sets of problems in a textbook.  In this course, students will use mathematics to help design digital images.  I’ll say more about this in later posts.

And second, I want students to have a  positive experience of mathematics.  This course might be the only math course they have to take in college, and I want them to enjoy it!  Given prevailing attitudes about mathematics in general, I think it is completely legitimate to have “students will begin to enjoy mathematics” as a course goal.

I also think that every student should learn some programming during their college career.  Granted, students will start by tweaking Python code I give to them, just like with the movie project.  Some students won’t progress much beyond this, but I am hopeful that others will.  Given the type of course this is, I really can’t have any prerequisites, so I’m assuming I will have students who either haven’t taken a math course in a year or two, and/or have never written a line of code before.

I’ll go into greater detail in the next few posts about content and course flow, but today I’ll share three project ideas which will drive much of the mathematics and programming content.  The first revolves around the piece Evaporation, which I discuss on Day011 and Day012 of my blog.

Day011Evaporation2bWeb

Creating a piece like this involves learning the basics of representing colors digitally, as well as basic programming ideas like variables and loops.

The second project revolves around the algorithm which produces the Koch curve, which I discuss in some detail on Day007, Day008, Day009, and Day027 of my blog.

Day007koch-45-175

By varying the usual angles in the Koch curve algorithm, a variety of interesting images may be produced.  Many exhibit chaotic behavior, but some, like the image above, actually “close up” and are beautifully symmetric.

It turns out that entire families of images which close up may be generated by choosing pairs of angles which are solutions to a particular linear Diophantine equation.  So I’ll introduce some elementary number theory so we can look at several families of solutions.

The third (and largest) project revolves around creating animated movies of iterated function systems, as I described in the last six posts.

This involves learning about linear and affine transformations in two dimensions, and how fractals may be described by iterated function systems.  The mathematics is at a bit higher level here, but students can still play with the algorithms to generate fractal images without having completely mastered the linear algebra.

But I think it’s worth it, so students can learn to create movies of fractals.  In addition, fractals are just cool.  I think using IFS is a good way not only to show students an interesting application of mathematics and programming, but also to foster an enjoyment of mathematics and programming as well.  I had great success with my linear algebra students in this regard.

I’d like to end this post with a few words on the process of creating a course like Mathematics and Digital Art at USF.  Some of these points might be obvious, others not — and some may not even be relevant at your particular school.

  • Start early!  In my case, the course needed to be first approved by the Dean, then next by a curriculum committee in order to receive a Core mathematics designation, and then finally by the First-Year Seminar committee.  The approval process took four months.
  • Consider having your course in a computer lab.  At USF, I could not require students to bring a laptop to class, since it could be the case that some students do not have their own personal computer.  I hadn’t anticipated this wrinkle.
  • Don’t reinvent the wheel!  One reason I’m writing about Mathematics and Digital Art on my blog is to make it easier for others to design a similar course.  I’ll be talking more about content and course flow in the next few posts, so feel free to use whatever might be useful.  And if would help, here is my course syllabus.

As I mentioned, next week’s post will focus more on the actual content of the course.  Stay tuned!

International Dodecahedron Day 2016!

I have always been fascinated by geometry in three dimensions.

Day028tRp_52-3-5

I can still remember an eighth-grade project in my algebra class where we built polyhedra — mine was a white icosahedron with smaller, orange equilateral triangles connecting the midpoints of the edges.  This is what an icosahedron looks like:

Day028Fig24b

I even naively tried to build an icosahedron by trying to glue twenty regular tetrahedra (triangular pyramids) together, thinking that if you took a face of the icosahedron and connected its vertices to the center of the polyhedron, the result would be a regular tetrahedron. It’s pretty close — but not quite there. I wondered why my model didn’t close up.

Next, I remember walking down the aisles of the mathematics and science library at Carnegie Mellon, looking at mathematical “picture books.” I don’t know how many times I checked out Polyhedron Models by Magnus Wenninger, just looking at all the photos of the paper polyhedron models, flipping back and forth between them, trying to see how they were related to each other.

With each model, there was a net — a set of connected polygons you could use to create the model. The net you see here is for a polyhedron called the rhombic dodecahedron.  I wondered how you could make each net.  Day028rhdodecaLater, I found out that there were lots of data published about various lengths and angles in different polyhedra — but those data were often numerical approximations, not exact values. What were the exact values?

These questions stimulated me to study more deeply — using tools such as coordinate geometry, linear algebra, and spherical trigonometry. I eventually answered many of the questions I asked so far, but of course generated many more questions, which were usually more difficult to answer.

Once I finished graduate school, I started writing a book on the mathematics of polyhedra, and eventually used it in a university-level geometry course. As I gained experience, I was asked to help design a senior capstone course for a local high school which used my text. A few years into this, my colleagues Todd Klauser and Sandy Spalt-Fulte helped organize a project where students in this senior course — as well as Todd’s other geometry students — went to a local middle school and taught the younger students how to make three-dimensional models of dodecahedra. And so Dodecahedron Day was born.

Dodecahedron Day is celebrated on December 5 of each year (for the 12 pentagons on a dodecahedron), and was first celebrated in 2005. Perhaps it’s a bit early in the year to talk about it — but just yesterday, I ran a booth at a fundraiser for the San Francisco Math Circle where we had students build three-dimensional models of different types of dodecahedra.

Day028ZOE_0015_1

What I love about this type of activity is how much the students love it as well.  The dodecahedron you see here was created by a young girl of about eight or nine years old — she worked painstakingly with her glue stick for close to an hour getting it together.  Her focus was intense.  No, it wasn’t perfect.  But it was hers.

Interestingly, the parents of several students also built models — and took home nets to build more!  And one of my student assistants, Simon, got very creative with decorating a net for a small stellated dodecahedron.

Day028ZOE_0019_1

Students have fun building polyhedra. Frankly, I think mathematical activities which are just fun are very useful activities — improving students’ attitudes about math is really critical to their success. Students perform better in subjects they like.

But in addition to being fun, building models requires focus and attention to detail, and also develops spatial abilities. In fact, an undergraduate in my 3D geometry course who later went on to get a Ph.D. in chemistry told me that my geometry course helped her in graduate school more than any of her chemistry courses! Just think about the geometry inherent in studying orbitals.

Over the years, I’ve developed many activities for Dodecahedron Day, and include some on the Day’s website www.dodecahedronday.org. For younger students, I’ve created activities involving pentominoes, since there are 12 pentominoes, each made up of five connected unit squares (keeping with the 12/5 theme). I’m sure others have and will continue to develop different activities — the important thing is that students take a day to truly enjoy doing geometry.

One thing I do insist upon, though, is that teachers don’t create a contest out of who makes the “best” dodecahedron. There’s too much competition in schools anyway, and it defeats the purpose of Dodecahedron Day to have a student who is genuinely proud of his model to leave the day thinking, “Mine was really nice, but hers was better. The teacher said so.”

The great thing is that once students learn basic model-making skills, they can search the internet for printable nets of almost any polyhedron they can think of. Pieces can be made from different colors, and particular color arrangmements of pieces can create really beautiful models.

Another reason for writing about Dodecahedron Day a bit early is that it really takes some planning. If a school or school district wants to set aside December 5 for activities, it’s best to make that decision before the school year starts — otherwise there may be time pressure to coordinate with course syllabi, school leadership and other teachers. Further, if teachers want to take their students to other schools so that their students can teach younger pupils how to build models, it helps to develop relationships with local schools if they don’t already exist. I can tell you from experience, the earlier you start, the better.

So if you’re a student reading this, ask your teacher to celebrate Dodecahedron Day this year! If you’re a teacher or school principal, think about it — and feel free to comment with questions, concerns, or ideas. I’m happy to help in any way I can.

And if you’re not from the US, consider introducing Dodecahedron Day into schools in your country! You’ll notice the title of today’s post — I’m hoping to make Dodecahedron Day 2016 an international event, and I can’t do it alone. Perhaps materials need to be translated, or simply reformatted for A4 paper…. By starting early, it’s possible to create an enjoyable experience for everyone involved.

So in anticipation, Happy Dodecahedron Day 2016! Let’s make this a day to introduce a passion for geometry to students all around the world!

Day028dd_ppl_pic1Web

On Grading

A few weeks ago, I posted a short satire on how I view one of the most common ways of assigning grades — taking points off for mistakes, and determining students’ grades by how many points are left.  Today, I’d like to take a more practical look, as well as describe a system I currently use in my teaching.

I can recall two events which started  me thinking more critically about grading practices. The first was a letter to the editor written in a mathematics journal.  The university professor described a final exam in a differential equations course — ten questions, worth ten points each.  To his dismay, no student earned ten points on any problem.  They got by with partial credit.

So he thought he’d try the following grading scheme:  no partial credit.  Each question was either correct (10 points) or incorrect (0 points).  To his surprise, the course average didn’t change significantly — students actually were much more careful because they knew the stakes were high.

Second, when teaching multiple-section precalculus courses at the high school level, I would need to give the same exams as my colleagues.  We’d sit around and ask questions like “How many points off for a sign error?”  “What if they just make a minor arithmetic mistake?”  We’d try to make sure everyone graded pretty much the same.  We’d even talk at the (insane) level of half-points….

So when developing an honors-level calculus course (at the high school level), I thought I’d try something different.  First, I separated exams into two sections:  Skills and Concepts.  And second, I’d grade problems as Completely Correct (CC), Essentially Correct (EC) — meaning a student knew how to approach a problem, but had significant issues in following through, or not correct (X) — indicating lack of a viable solution strategy.

I’d then assign a letter grade based on the CC/EC distribution.  This is along the lines of the university professor’s thought — you can’t earn an A if you don’t have a certain number of problems Completely Correct.  In other words, a student must demonstrate significant mastery in solving problems, not just get by on partial credit.

I do know of professors who use a “2–1–0” scheme — and this is certainly similar.  Assigning a CC 2 points, an EC 1 point, and an X zero points can help in giving an approximate idea of where a student stands.  But I also use grades of CC- (perhaps more than a few arithmetic errors), EC+ (almost CC), and EC- (got the right idea, but just barely).  If a lot of the EC’s are in fact EC+’s, I might bump the grade up a notch.

I also differentiate between Skills and Concepts questions.  Skills questions are more-or-less textbook problems — routine, checking that a student knows the mechanics.  They are relative short, although I might sometimes assign two CC/EC/X grades if the problem is a little more involved.

I purposely avoid problems which scaffold in the Skills section.  For example, if you want to assess integration by parts through a volume problem, and the student sets up the volume integral incorrectly, then you may not be able to assess their ability to perform integration by parts.  I address this issue by writing two separate Skills questions:  first, a “set up but do not evaluate” volume problem, and an integration by parts problem.  I don’t feel anything is lost here.

The Concepts questions are intended to assess whether students really have some conceptual understanding.  They are typically open-ended, and require some argument (though a formal proof is not necessary in calculus).  As an example, here is a Concepts problem from a Calculus II exam given last semester:

For each of the following statements, either justify why it is true, or give a counterexample to show that it is false.

(1) If \displaystyle\sum_{n=0}^\infty |a_n| and \displaystyle\sum_{n=0}^\infty |b_n| converge, then \displaystyle\sum_{n=0}^\infty |a_n+b_n| converges.

(2) If \displaystyle\sum_{n=0}^\infty |a_n+b_n| converges, then both \displaystyle\sum_{n=0}^\infty |a_n| and \displaystyle\sum_{n=0}^\infty |b_n| converge.

This is certainly a non-routine question.  As such, I grade Concepts problems more leniently, assigning an EC if it seems that a student has shown some insight into the problem.

On this 65-minute exam, there were seven Skills problems and four Concepts problems.  To earn an A, a student needed 5 CC and 3 EC.  The 5 CC meant that there had to be significant Skills mastery.  But note that if an A student earned at least an EC on all the Skills problems (which they should certainly do), they only needed to make progress on one of the four Concepts problems to earn an A.

I try to design the Skills part so that it takes about 45–50 minutes to complete, leaving 15–20 minutes to think about one (or more) Concepts problem(s).  And as the grading scheme implies, some progress needs to be made on the Concepts problems to earn an A, which is as it should be — an A student should be able to demonstrate some level of conceptual understanding.

Further, I might bump up the grade if a student can make progress on more than one Concepts problem, or perhaps gets one CC (which does not occur all that often in my classes).

I’ve been using this scheme for about seven years now, and I like it.  Grading is more pleasant (no agonizing over points), students rarely argue about EC/CC (it’s not that fine a distinction), and I can count on one hand (with fingers left over) the number of students who have argued about the assignment of a letter grade.  What’s also nice about this scheme is that it’s easy to adjust for exams which are (inadvertently) too difficult — just relax the requirements needed for an A.

Now to some extent, this may seem highly subjective.  But I maintain that it is no more subjective than assigning points.  Precisely how are those assignments made?  If a quotient rule problem is worth 10 points and the student switches the order of the terms on the numerator, is it 1 point off?  2 points?  Maybe 3?  How many “tenths” of the 10-point problem is the order of the terms on the numerator worth, anyway?  It’s truly an arbitrary decision.

A point-based system does suggest that problem-solving can be broken down into separate chunks which can be assembled to make a whole — something mathematicians know to be ridiculously hard to quantify, if it is possible at all.

Now I do admit to giving point-based exams in courses like Business Statistics — a 13-section course of which I taught two sections last semester.  I had almost 50 students, and the course is essentially a skills-oriented course.  Like any other teaching strategy, a grading style may seem more appropriate in one context than another.

So I am not advocating a “one size fits all” grading practice here.  My intent is to suggest that there are successful alternatives to a strictly point-based grading system.  And while every system has its drawbacks, I believe that one of the main strengths of the system described in this post lies in the ability to meaningfully assess conceptual understanding — something I have found virtually impossible in a point-based system.