Calculus: Hyperbolic Trigonometry, I

love hyperbolic trigonometry.  I always include it when I teach calculus, as I think it is important for students to see.  Why?

  1.  Many applications in the sciences use hyperbolic trigonometry; for example, the use of Laplace transforms in solving differential equations, various applications in physics, modeling population growth (the logistic model is a hyperbolic tangent curve);
  2. Hyperbolic trigonometric substitutions are, in many instances, easier than circular trigonometric substitutions, especially when a substitution involving \tan(x) or \sec(x) is involved;
  3. Students get to see another form of trigonometry, and compare the new form with the old;
  4. Hyperbolic trigonometry is fun.

OK, maybe that last reason is a bit of hyperbole (though not for me).

Not everyone thinks this way.  I once had a colleague who told me she did not teach hyperbolic trigonometry because it wasn’t on the AP exam.  What do you say to someone who says that?  I dunno….

In any case, I want to introduce the subject here for you, and show you some interesting aspects of hyperbolic trigonometry.  I’m going to stray from my habit of not discussing things you can find anywhere online, since in order to get to the better stuff, you need to know the basics.  I’ll move fairly quickly through the introductory concepts, though.

The hyperbolic cosine and sine are defined by

\cosh(x)=\dfrac{e^x+e^{-x}}2,\quad\sinh(x)=\dfrac{e^x-e^{-x}}2,\quad x\in\mathbb{R}.

I will admit that when I introduce this definition, I don’t have an accessible, simple motivation for doing so.  I usually say we’ll learn a lot more as we work with these definitions, so if anyone has a good idea in this regard, I’d be interested to hear it.

The graphs of these curves are shown below.
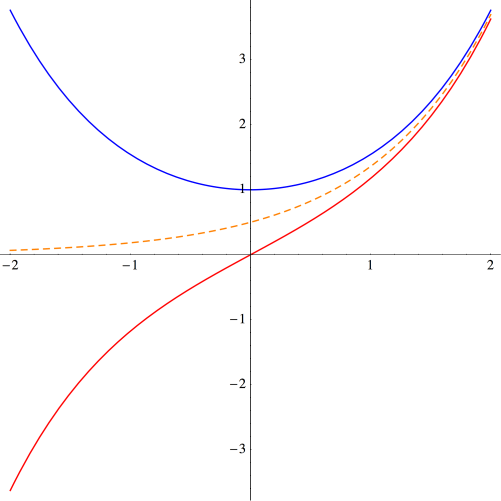
Day142Hyp1

The graph of \cosh(x) is shown in blue, and the graph of \sinh(x) is shown in red.  The dashed orange graph is y=e^{x}/2, which is easily seen to be asymptotic to both graphs.

Parallels to the circular trigonometric functions are already apparent:  y=\cosh(x) is an even function, just like y=\cos(x).  Similarly, \sinh(x) is odd, just like \sin(x).

Another parallel which is only slight less apparent is the fundamental relationship

\cosh^2(x)-\sinh^2(x)=1.

Thus, (\cosh(x),\sinh(x)) lies on a unit hyperbola, much like (\cos(x),\sin(x)) lies on a unit circle.

While there isn’t a simple parallel with circular trigonometry, there is an interesting way to characterize \cosh(x) and \sinh(x).  Recall that given any function f(x), we may define

E(x)=\dfrac{f(x)+f(-x)}2,\quad O(x)=\dfrac{f(x)-f(-x)}2

to be the even and odd parts of f(x), respectively.  So we might simply say that \cosh(x) and \sinh(x) are the even and odd parts of e^x, respectively.

There are also many properties of the hyperbolic trigonometric functions which are reminiscent of their circular counterparts.  For example, we have

\sinh(2x)=2\sinh(x)\cosh(x)

and

\sinh(x+y)=\sinh(x)\cosh(y)+\sinh(y)\cosh(x).

None of these are especially difficult to prove using the definitions.  It turns out that while there are many similarities, there are subtle differences.  For example,

\cosh(x+y)=\cosh(x)\cosh(y)+\sinh(x)\sinh(y).

That is, while some circular trigonometric formulas become hyperbolic just by changing \cos(x) to \cosh(x) and \sin(x) to \sinh(x), sometimes changes of sign are necessary.

These changes of sign from circular formulas are typical when working with hyperbolic trigonometry.  One particularly interesting place the change of sign arises is when considering differential equations, although given that I’m bringing hyperbolic trigonometry into a calculus class, I don’t emphasize this relationship.  But recall that \cos(x) is the unique solution to the differential equation

y''+y=0,\quad y(0)=1,\quad y'(0)=0.

Similarly, we see that \cosh(x) is the unique solution to the differential equation

y''-y=0,\quad y(0)=1,\quad y'(0)=0.

Again, the parallel is striking, and the difference subtle.

Of course it is straightforward to see from the definitions that (\cosh(x))'=\sinh(x) and (\sinh(x))'=\cosh(x).  Gone are the days of remembering signs when differentiating and integrating trigonometric functions!  This is one feature of hyperbolic trigonometric functions which students always appreciate….

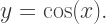
Another nice feature is how well-behaved the hyperbolic tangent is (as opposed to needing to consider vertical asymptotes in the case of \tan(x)).  Below is the graph of y=\tanh(x)=\sinh(x)/\cosh(x).

Day142Hyp2

The horizontal asymptotes are easily calculated from the definitions.  This looks suspiciously like the curves obtained when modeling logistic growth in populations; that is, finding solutions to

\dfrac{dP}{dt}=kP(C-P).

In fact, these logistic curves are hyperbolic tangents, which we will address in more detail in a later post.

One of the most interesting things about hyperbolic trigonometric functions is that their inverses have closed formulas — in striking contrast to their circular counterparts.  I usually have students work this out, either in class or as homework; the derivation is quite nice, so I’ll outline it here.

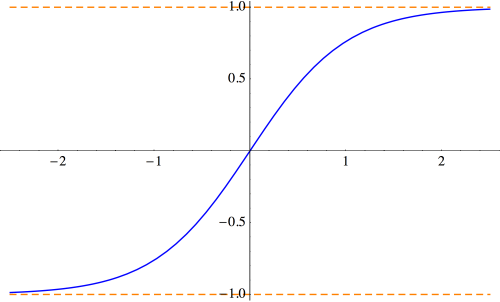
So let’s consider solving the equation x=\sinh(y) for y.  Begin with the definition:

x=\dfrac{e^y-e^{-y}}2.

The critical observation is that this is actually a quadratic in e^y:

(e^y)^2-2xe^y-1=0.

All that is necessary is to solve this quadratic equation to yield

e^y=x\pm\sqrt{1+x^2},

and note that x-\sqrt{1+x^2} is always negative, so that we must choose the positive sign.  Thus,

y=\hbox{arcsinh}(x)=\ln(x+\sqrt{1+x^2}).

And this is just the beginning!  At this stage, I also offer more thought-provoking questions like, “Which is larger, \cosh(\ln(42)) or \ln(\cosh(42))?  These get students working with the definitions and thinking about asymptotic behavior.

Next week, I’ll go into more depth about the calculus of hyperbolic trigonometric functions.  Stay tuned!

Calculus: Linear Approximations, II

As I mentioned last week, I am a fan of emphasizing the idea of a derivative as a linear approximation.  I ended that discussion by using this method to find the derivative of \tan(x).   
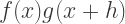
Today, we’ll look at some more examples, and then derive the product, quotient and chain rules.

Differentiating \sec(x) is particularly nice using this method.  We first approximate

\sec(x+h)=\dfrac1{\cos(x+h)}\approx\dfrac1{\cos(x)-h\sin(x)}.

Then we factor out a \cos(x) from the denominator, giving

\sec(x+h)\approx\dfrac1{\cos(x)(1-h\tan(x))}.

As we did at the end of last week’s post, we can make h as small as we like, and so approximate by considering 1/(1-h\tan(x)) as the sum of an infinite series:

\dfrac1{1-h\tan(x)}\approx1+h\tan(x).

Finally, we have

\sec(x+h)\approx\dfrac{1+h\tan(x)}{\cos(x)}=\sec(x)+h\sec(x)\tan(x),

which gives the derivative of \sec(x) as \sec(x)\tan(x).

We’ll look at one more example involving approximating with geometric series before moving on to the product, quotient, and chain rules.  Consider differentiating x^{-n}. We first factor the denominator:

\dfrac1{(x+h)^n}=\dfrac1{x^n(1+h/x)^n}.

Now approximate

\dfrac1{1+h/x}\approx1-\dfrac hx,

so that, to first order,

\dfrac1{(1+h/x)^n}\approx \left(1-\dfrac hx\right)^{\!\!n}\approx 1-\dfrac{nh}x.

This finally results in

\dfrac1{(x+h)^n}\approx \dfrac1{x^n}\left(1-\dfrac{nh}x\right)=\dfrac1{x^n}+h\dfrac{-n}{x^{n+1}},

giving us the correct derivative.

Now let’s move on to the product rule:

(fg)'(x)=f(x)g'(x)+f'(x)g(x).

Here, and for the rest of this discussion, we assume that all functions have the necessary differentiability.

We want to approximate f(x+h)g(x+h), 
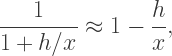
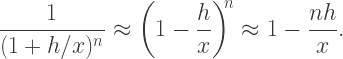
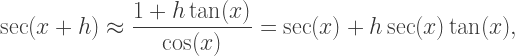
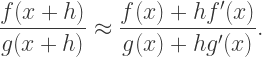
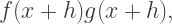
so we replace each factor with its linear approximation:
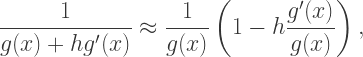
f(x+h)g(x+h)\approx (f(x)+hf'(x))(g(x)+hg'(x)).

Now expand and keep only the first-order terms:

f(x+h)g(x+h)\approx f(x)g(x)+h(f(x)g'(x)+f'(x)g(x)).

And there’s the product rule — just read off the coefficient of h.

There is a compelling reason to use this method.  The traditional proof begins by evaluating

\displaystyle\lim_{h\to0}\dfrac{f(x+h)g(x+h)-f(x)g(x)}h.

The next step?  Just add and subtract f(x)g(x+h) (or perhaps f(x+h)g(x)
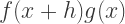
).  I have found that there is just no way to convincingly motivate this step.  Yes, those of us who have seen it crop up in various forms know to try such tricks, but the typical first-time student of calculus is mystified by that mysterious step.  Using linear approximations, there is absolutely no mystery at all.
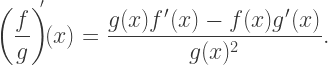
The quotient rule is next:

\left(\dfrac fg\right)^{\!\!\!'}\!(x)=\dfrac{g(x)f'(x)-f(x)g'(x)}{g(x)^2}.

First approximate

\dfrac{f(x+h)}{g(x+h)}\approx\dfrac{f(x)+hf'(x)}{g(x)+hg'(x)}.

Now since h is small, we approximate

\dfrac1{g(x)+hg'(x)}\approx\dfrac1{g(x)}\left(1-h\dfrac{g'(x)}{g(x)}\right),

so that

\dfrac{f(x+h)}{g(x+h)}\approx(f(x)+hf'(x))\cdot\dfrac1{g(x)}\left(1-h\dfrac{g'(x)}{g(x)}\right).

Multiplying out and keeping just the first-order terms results in

\dfrac{f(x+h)}{g(x+h)}\approx f(x)g(x)+h\dfrac{g(x)f'(x)-f(x)g'(x)}{g(x)^2}.

Voila!  The quotient rule.  Now usual proofs involve (1) using the product rule with f(x) and 1/g(x), but note that this involves using the chain rule to differentiate 1/g(x);  or (2) the mysterious “adding and subtracting the same expression” in the numerator.  Using linear approximations avoids both.

The chain rule is almost ridiculously easy to prove using linear approximations.  Begin by approximating

f(g(x+h))\approx f(g(x)+hg'(x)).

Note that we’re replacing the argument to a function with its linear approximation, but since we assume that f is differentiable, it is also continuous, so this poses no real problem.  Yes, perhaps there is a little hand-waving here, but in my opinion, no rigor is really lost.

Since g is differentiable, then g'(x) exists, and so we can make hg'(x) as small as we like, so the “hg'(x)” term acts like the “h” term in our linear approximation.  Additionally, the “g(x)” term acts like the “x” term, resulting in

f(g(x+h)\approx f(g(x))+hg'(x)f'(g(x)).

Reading off the coefficient of h gives the chain rule:

(f\circ g)'(x)=f'(g(x))g'(x).

So I’ve said my piece.  By this time, you’re either convinced that using linear approximations is a good idea, or you’re not.  But I think these methods reflect more accurately the intuition behind the calculations — and reflect what mathematicians do in practice.

In addition, using linear approximations involves more than just mechanically applying formulas.  If all you ever do is apply the product, quotient, and chain rules, it’s just mechanics.  Using linear approximations requires a bit more understanding of what’s really going on underneath the hood, as it were.

If you find more neat examples of differentiation using this method, please comment!  I know I’d be interested, and I’m sure others would as well.

In my next installment (or two or three) in this calculus series, I’ll talk about one of my favorite topics — hyperbolic trigonometry.

Calculus: Linear Approximations, I

Last week’s post on the Geometry of Polynomials generated a lot of interest from folks who are interested in or teach calculus.  So I thought I’d start a thread about other ideas related to teaching calculus.

This idea is certainly not new.  But I think it is sorely underexploited in the calculus classroom.  I like it because it reinforces the idea of derivative as linear approximation.

The main idea is to rewrite

\displaystyle\lim_{h\to 0}\dfrac{f(x+h)-f(x)}h=f'(x)

as

f(x+h)\approx f(x)+hf'(x),

with the note that this approximation is valid when h\approx0.  Writing the limit in this way, we see that f(x+h), as a function of h, is linear in h in the sense of the limit in the definition actually existing — meaning there is a good linear approximation to f at x.

Moreover, in this sense, if

f(x+h)\approx f(x)+hg(x),

then it must be the case that f'(x)=g(x).  This is not difficult to prove.

Let’s look at a simple example, like finding the derivative of f(x)=x^2.  It’s easy to see that

f(x+h)=(x+h)^2=x^2+h(2x)+h^2.

So it’s easy to read off the derivative: ignore higher-order terms in h, and then look at the coefficient of h as a function of x.

Note that this is perfectly rigorous.  It should be clear that ignoring higher-order terms in h is fine since when taking the limit as in the definition, only one h divides out, meaning those terms contribute 0 to the limit.  So the coefficient of h will be the only term to survive the limit process.

Also note that this is nothing more than a rearrangement of the algebra necessary to compute the derivative using the usual definition.  I just find it is more intuitive, and less cumbersome notationally.  But every step taken can be justified rigorously.

Moreover, this method is the one commonly used in more advanced mathematics, where  functions take vectors as input.  So if

f({\bf v})={\bf v}\cdot{\bf v},

we compute

f({\bf u}+h{\bf v})={\bf u}\cdot{\bf u}+2h{\bf u}\cdot{\bf v}+h^2{\bf v}\cdot{\bf v},

and read off

\nabla_{\bf v}f({\bf u})=2{\bf u}\cdot{\bf v}.

I don’t want to go into more details here, since such calculations don’t occur in beginning calculus courses.  I just want to point out that this way of computing derivatives is in fact a natural one, but one which you don’t usually encounter until graduate-level courses.

Let’s take a look at another example:  the derivative of f(x)=\sin(x), and see how it looks using this rewrite.  We first write

\sin(x+h)=\sin(x)\cos(h)+\cos(x)\sin(h).

Now replace all functions of h with their linear approximations.  Since \cos(h)\approx1 and \sin(h)\approx h near h=0, we have

\sin(x+h)\approx\sin(x)+h\cos(x).

This immediately gives that \cos(x) is the derivative of \sin(x).

Now the approximation \cos(h)\approx1 is easy to justify geometrically by looking at the graph of \cos(x).  But how do we justify the approximation \sin(h)\approx h?

Of course there is no getting around this.  The limit

\displaystyle\lim_{h\to0}\dfrac{\sin(h)}h

is the one difficult calculation in computing the derivative of \sin(x).  So then you’ve got to provide your favorite proof of this limit, and then move on.  But this approximation helps to illustrate the essential point:  the differentiability of \sin(x) at x=0 does, in a real sense, imply the differentiability of \sin(x) everywhere else.

So computing derivatives in this way doesn’t save any of the hard work, but I think it makes the work a bit more transparent.  And as we continually replace functions of h with their linear approximations, this aspect of the derivative is regularly being emphasized.

How would we use this technique to differentiate f(x)=\sqrt x?  We need

\sqrt{x+h}\approx\sqrt x+hf'(x),

and so

x+h\approx \left(\sqrt x+hf'(x)\right)^2\approx x+2h\sqrt xf'(x).

Since the coefficient of h on the left is 1, so must be the coefficient on the right, so that

2\sqrt xf'(x)=1.

As a last example for this week, consider taking the derivative of f(x)=\tan(x).  Then we have

\tan(x+h)=\dfrac{\tan(x)+\tan(h)}{1-\tan(x)\tan(h)}.

Now since \sin(h)\approx h and \cos(h)\approx 1, we have \tan(h)\approx h, and so we can replace to get

\tan(x+h)\approx\dfrac{\tan(x)+h}{1-h\tan(x)}.

Now what do we do?  Since we’re considering h near 0, then h\tan(x) is small (as small as we like), and so we can consider

\dfrac1{1-h\tan(x)}

as the sum of the infinite geometric series

\dfrac1{1-h\tan(x)}=1+h\tan(x)+h^2\tan^2(x)+\cdots

Replacing, with the linear approximation to this sum, we get

\tan(x+h)\approx(\tan(x)+h)(1+h\tan(x)),

and so

\tan(x+h)\approx\tan(x)+h(1+\tan^2(x)).

This give the derivative of \tan(x) to be

1+\tan^2(x)=\sec^2(x).

Neat!

Now this method takes a bit more work than just using the quotient rule (as usually done).  But using the quotient rule is a purely mechanical process; this way, we are constantly thinking, “How do I replace this expression with a good linear approximation?”  Perhaps more is learned this way?

There are more interesting examples using this geometric series idea.  We’ll look at a few more next time, and then use this idea to prove the product, quotient, and chain rules.  Until then!

The Geometry of Polynomials

I recently needed to make a short demo lecture, and I thought I’d share it with you.  I’m sure I’m not the first one to notice this, but I hadn’t seen it before and I thought it was an interesting way to look at the behavior of polynomials where they cross the x-axis.

The idea is to give a geometrical meaning to an algebraic procedure:  factoring polynomials.  What is the geometry of the different factors of a polynomial?

Let’s look at an example in some detail:  f(x)=2(x-4)(x-1)^2.poly0b

Now let’s start looking at the behavior near the roots of this polynomial.

poly0c

Near x=1, 
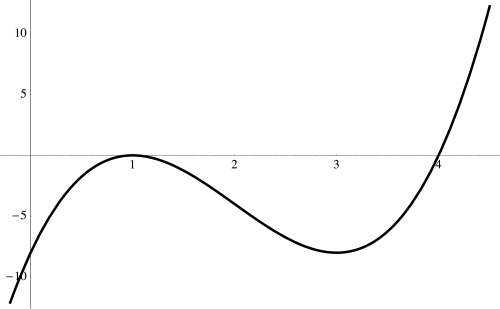
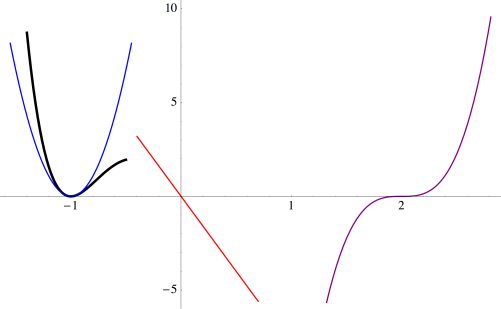
the graph of the cubic looks like a parabola — and that may not be so surprising given that the factor (x-1) occurs quadratically.

poly0d

And near x=4, 
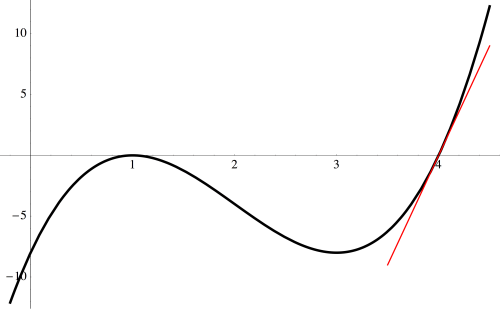
the graph passes through the x-axis like a line — and we see a linear factor of (x-4) in our polynomial.

But which parabola, and which line?  It’s actually pretty easy to figure out.  Here is an annotated slide which illustrates the idea.

Day137poly1

All you need to do is set aside the quadratic factor of (x-1)^2, 
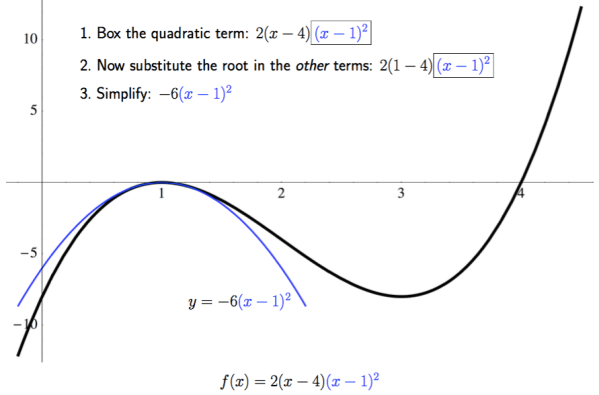
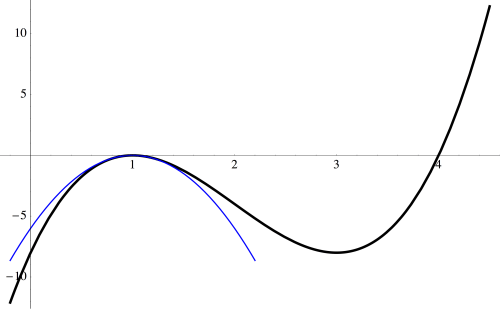
and substitute the root, x=1, in the remaining terms of the polynomial, then simplify.  In this example, we see that the cubic behaves like the parabola y=-6(x-1)^2 near the root x=1. Note the scales on the axes; if they were the same, the parabola would have appeared much narrower.
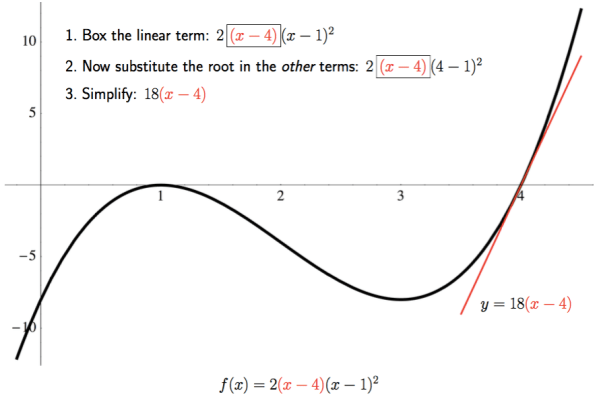
We perform a similar calculation at the root x=4.

Day137poly2

Just isolate the linear factor (x-4), substitute x=4 in the remaining terms of the polynomial, and then simplify.  Thus, the line y=18(x-4) best describes the behavior of the graph of the polynomial as it passes through the x-axis.  Again, note the scale on the axes.

We can actually use this idea to help us sketch graphs of polynomials when they’re in factored form.  Consider the polynomial f(x)=x(x+1)^2(x-2)^3.  Begin by sketching the three approximations near the roots of the polynomial.  This slide also shows the calculation for the cubic approximation.

Day137poly3.png

Now you can begin sketching the graph, starting from the left, being careful to closely follow the parabola as you bounce off the x-axis at x=-1.

poly1d

Continue, following the red line as you pass through the origin, and then the cubic as you pass through x=2.  
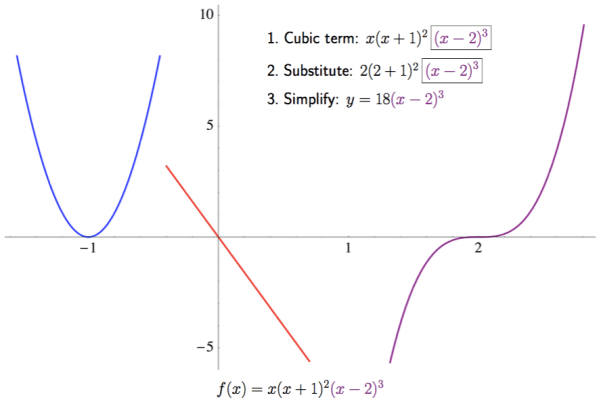
Of course you’d need to plot a few points to know just where to start and end; this just shows how you would use the approximations near the roots to help you sketch a graph of a polynomial.
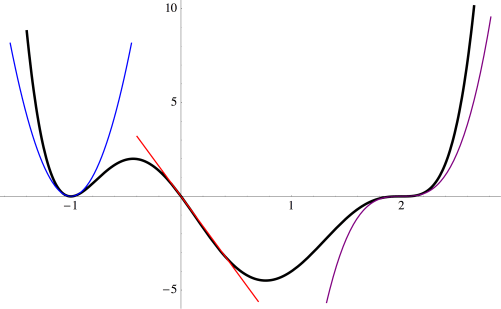
poly1f

Why does this work?  It is not difficult to see, but here we need a little calculus.  Let’s look, in general, at the behavior of f(x)=p(x)(x-a)^n near the root x=a.  Given what we’ve just been observing, we’d guess that the best approximation near x=a would just be y=p(a)(x-a)^n.

Just what does “best approximation” mean?  One way to think about approximating, calculuswise, is matching derivatives — just think of Maclaurin or Taylor series.  My claim is that the first n derivatives of f(x)=p(x)(x-a)^n and y=p(a)(x-a)^n match at x=a.

First, observe that the first n-1 derivatives of both of these functions at x=a must be 0.  This is because (x-a) will always be a factor — since at most n-1 derivatives are taken, there is no way for the (x-a)^n term to completely “disappear.”

But what happens when the nth derivative is taken?  Clearly, the nth derivative of p(a)(x-a)^n at x=a is just n!p(a).  What about the nth derivative of f(x)=p(x)(x-a)^n?

Thinking about the product rule in general, we see that the form of the nth derivative must be f^{(n)}(x)=n!p(x)+ (x-a)(\text{terms involving derivatives of } p(x)). When a derivative of p(x) is taken, that means one factor of (x-a) survives.

So when we take f^{(n)}(a), we also get n!p(a).  This makes the nth derivatives match as well.  And since the first n derivatives of p(x)(x-a)^n and p(a)(x-a)^n match, we see that p(a)(x-a)^n is the best nth degree approximation near the root x=a.

I might call this observation the geometry of polynomials. Well, perhaps not the entire geometry of polynomials….  But I find that any time algebra can be illustrated graphically, students’ understanding gets just a little deeper.

Those who have been reading my blog for a while will be unsurprised at my geometrical approach to algebra (or my geometrical approach to anything, for that matter).  Of course a lot of algebra was invented just to describe geometry — take the Cartesian coordinate plane, for instance.  So it’s time for algebra to reclaim its geometrical heritage.  I shall continue to be part of this important endeavor, for however long it takes….

Mathematics and Digital Art: Final Update (Fall 2017)

Yes, it is the end of another semester of Mathematics and Digital Art!  It was a very different semester than the first two, as I have mentioned in previous posts, since I began the semester with Processing right away.  There are still a few wrinkles to iron out — for example, we had a lab project on interactivity (involving using key presses to change features of the movie as it is running) which was quite a bit more challenging than I expected it would be.  But on the whole, I think it was an improvement.

So in this final post for Fall 2017, I’d like to share some examples of student work.  In particular, I’ll look at some examples from the Fractal Movie Project, as well as examples of Final Projects.

Recall that the Fractal Movie Project involves using linear interpolation on the parameters in affine transformations in order to make an animated series of fractal images.  One student experimented with a bright color palette against a black background.  As the fractal morphed, it actually looked like the red part of the image rotated in three dimensions, even though the affine transformations were only two-dimensional.

MAK


Cissy wanted to explore the motion of rain in her movie.  Although she began with bright colors on a black background, once she saw her fractal in motion, she decided that more subtle colors on a white background would be better suited to suggest falling raindrops being blown about by the wind.MCissy


Sepid also incorporated movement in her movie — she created a rotating galaxy with a color palette inspired by the colors of the Aurora Borealis.  In addition, she learned how to use the Minim library so she could incorporate sound into her movie as well.  Here is a screen shot from her movie.

MSepid


Now let’s take a look at a few Final Projects.  Recall that these projects were very open-ended so that students could go in a direction of their choice.  Some really got into their work, with truly inspirational results.  The presentation that Sepid gave at a recent meeting of the Bay Area Mathematical Artists was actually work she was doing on her Final Project (read about it here).

Terry took on an ambitious project. She based her work on a Bridges paper by Adam Colestock, Let the Numbers Do the Walking: Generating Turtle Dances on the Plane from Integer Sequences (read the paper here).  Terry did have some programming experience coming into the course, and so she decided to code all of Adam’s turtle graphics algorithms from scratch! This was no simple task, but she worked hard and eventually accomplished her goal.

Here is a screen shot from one of her movies; Terry wanted to create an interesting visual effect by overlaying multiple copies of the same turtle path.  Since this particular path was not too dense in the plane, she was able to work with thicker lines.

FPTerry

Tera created a movie which involved rotating triangles and moving dots.  Her movie had a strong sense of motion, and incorporated a vibrant color palette. She remarked that working with color in this project was both fun and quite challenging. In her words, “Playing nicely with hot pink is not an easy feat.”

FP_TG


I would also like to share the fact that Professor Roza Aceska of Ball State University (Muncie, Indiana) will be teaching a course about digital art next semester using Processing which will be incorporating a lot of my course materials.  I am very excited about this!  Many faculty who come to my talks say they are interested in teaching such a course, but getting Department Chairs and Deans to approve such courses is sometimes an uphill battle.

Professor Aceska’s course will be a bit different from mine — her course is in the Honors Program, and as such, does not count as a mathematics credit.  So she will not have most of the mathematics assignments and quizzes that I had in my course.  But she will still be emphasizing the fascinating relationship between mathematics, programming, and art.  I hope to write more about her course sometime during the next semester.

One final remark — I am helping to organize a Mathematical Art Exhibition at the Golden Section Meeting of the Mathematical Association of America on February 24, 2018 at the California State University, East Bay.  So if you’re reading this and are in the Bay Area and would like to submit some mathematical art for inclusion in our exhibit, please let me know!


On Coding XIII: Retrospective.

I published the first installment of On Coding on September 11, 2016.  It seems a bit surreal that this thread is over a year old — but all good things must come to an end.  I really enjoyed writing these posts; they helped me organize my thoughts about my own personal coding history.

But there are some loose ends I’d like to tie up.  I’ve had brief forays into other languages — too brief to devote an entire post to any one of them.  I’ve mentioned a few of them here and there, but I’d like to take the opportunity to include them all in one post.

Before doing so, I should mention that Processing is my most recent programming adventure.  But I have written so much about using Processing in the context of my digital art course, I don’t feel the need to devote a separate post to it.  And I feel I might bore you, dear reader….

The first is PASCAL, which I first learned while taking an undergraduate programming class.  Other than the course, I only did a few other things with PASCAL.  I did write a routine that printed out 4 x 4 magic squares — I was really into magic squares back in college.  I also dabbled with computer graphics and geometrical inversion — I recall giving a talk where I discussed geometrical inversion, and I split the screen so on one side you saw lines tangent to a conic section, while on the other side, you saw inverse circles tangent to the inverse limaçon.

While in graduate school, I had a one-year stint filling in for a faculty member at a nearby college, and I taught a data structures course using PASCAL.  Now, I would never think of PASCAL as a go-to language for any particular purpose.  It’s still around, but not nearly as popular as it was then.

The next is LISP*, which I used while teaching at a summer program during graduate school.  This was a parallel version of LISP written for the Connection Machine, a state-of-the-art supercomputer in its day.  It had literally thousands of different processors, each very simple.  But because of the sheer number of processors, the speed of the Connection Machine merited it the designation “supercomputer.”

The language was quite similar to LISP, except that many functions had parallel versions which could be executed on each processor.  I can’t recall much of what I did on the Connection Machine, but I do remember programming Conway’s Game of Life on a 1000 x 1000 torus.  Of course I can do that on my laptop right now in Mathematica, but at the time, it was a real feat!  Remember, that was back in the day when Mandelbrot sets were calculated pixel by pixel and computers were so slow you could actually see the pixels march right on by….

Chronologically, Maple — a direct competitor of Mathematica — comes next, sort of…I used Maple around the same time as LISP*.  I seem to recall the only reason I played around with it was that I had a house-sitting job for a few summers, and there was a computer I could use which had Maple on it.

I recall finding Maple really useful, but there was a bit more syntax than with Mathematica.  I really like Mathematica‘s fundamental data type — the list, just like LISP.  But I think part of the reason I’ve stuck with Mathematica through the years is that most places I’ve been have supported it — and being free is a big advantage.  I know Maple has changed a lot since I last used it, so I don’t feel I’m able to say more about a comparison with Mathematica than what I’ve already said.

Jump ahead a few years to C++.  I can’t remember exactly when I started learning it, but I was teaching at a small liberal arts college, and a colleague who usually taught an algorithms course was going on sabbatical.  I was really the only other faculty member at the university qualified to teach it, and so there it was!  The students in the course knew C++, so I needed to learn it, too….

Well, I should say I learned enough to write code for an introductory algorithms course, which means I didn’t have to dive too deeply in.  I can’t say I used C++ for much after I taught the course, except I remember writing some routines to do financial planning.  You know, like if you have different investments at different interest rates for different numbers of years, etc., how much will you have when you retire?  (Being a mathematician, I thought it insane that I should pay someone else to do my financial planning, so I read everything I could on the topic and did it myself.)  But I haven’t used C++ since.

Last — and perhaps least — there’s Java.  I learned Java was when I was applying for a job teaching mathematics and computer science, and the language taught was Java.  I had never written a line in Java before, and there was some concern that I wasn’t qualified.

So I wrote a little interactive game based on some puzzles I created, which was really quite nice, if I must say.  The only way to show you know how to code in a language is to code, so I did it.

It was rather unpleasant, though.  What I needed to do was really just algorithmic, and the object-orientedness of Java and the need to precisely define data structures really got in the way.  I hope never to write another line of Java again.  (Incidentally — long story — I was offered the job but turned it down.  Saved me from teaching Java….)

And I think that’s about it!  If I can leave you with anything after this series, it’s GO CODE!  Learn as many different types of languages as you can.  The best way to learn is to find something you really want to do, and then go for it.

Remember, my first programming language was Fortran — using punch cards.  Running batch jobs.  Today, you’ve got laptops and the internet.  The only limit is your imagination….


On Coding XII: Python

It has been some time since I wrote an installment of On Coding.  It’s time to address one of my more recent programming adventures:  Python.  I started learning Python about two-and-a-half years ago when I began teaching at the University of San Francisco.

One of my colleagues introduced me to the Sage environment (now going by “CoCalc”) as a place to do Mathematica-like calculations, albeit at a smaller scale.  Four features were worthy of note to me:  1)  you could do graphics;  2)  you could write code (in Python);  3)  you could run the environment in your browser without downloading anything;  and 4)  it was open source.

For me, this was (at the time) the perfect environment to develop tools for creating digital art which I could freely share.  Yes, I had thousands of lines of Mathematica code, but Mathematica is fairly expensive.  I wanted an environment which would be easily accessible to students (and my blog followers!), and Sage fit the bill.

So that’s why I started learning Python — it was the language I needed to learn in order to use Sage.

For me, two things were a challenge.  The first was how heavily typed Python is.  In Mathematica, the essential data structure is a list, just like in LISP.  For example,

{1, 2, 3}

is a list.  But that list may also represent a vector in three-dimensional space — even though it would look exactly the same.  It may also represent a set of numbers, so you could calculate

Intersection[{1, 2, 3}, {3, 4, 5}].

In Python you can create a list, tuple, or set, as follows:

list([1, 2, 3]),  tuple([1, 2, 3]), set([1, 2, 3]).

And in Python, these are three different objects, none equal to any other.  I don’t necessarily want to start a discussion of typed vs. untyped languages, but when you’re so used to using an untyped language, like Mathematica, you are constantly wondering if the argument to some random Python function is a list, tuple, or….

Second, Python has a “return” statement.  In languages like LISP and Mathematica, the value of the last statement executed is automatically returned.  In Python, you have to specify that you want a value returned by using a return statement.  I forget this all the time.

And while not a huge obstacle, it does take a little while to get used to integer division.  In Python, 3/4 = 0, since when you divide integers, the value of the fraction is the quotient when considered as integer division.  But 3/4. = 0.75, since adding the decimal point after the 4 indicates the number is a floating point number, and so floating-point arithmetic is performed.

Of course, if you’ve been reading recent posts, you know I’ve moved from Sage entirely to Processing in my Mathematics and Digital Art course.  You can read more about that decision here — but one key feature of Processing is that there’s a Python mode, so I was able to take work already done in Sage and adapt it for Processing.

It turns out that this was not as easy as I had hoped.  The essential difficulty is that in Sage, the bounding box of your image is computed for you, and your image is appropriately scaled and displayed on the screen.  In Processing, you’ve got to do that on your own, as well as work in a space where x– and y-coordinates are in units of pixels, which is definitely not how I am used to thinking about geometry.

I am finding out, however — much to my delight and surprise — that there are quite a few functional programming aspects built into Python.  I suspect there are many more than I’m familiar with, but I’m learning them a little at a time.

For example, I am very fond of using maps and function application in Mathematica to do some calculations efficiently.  Rather than use a loop to, say, add the squares of the numbers 1– 10, in Mathematica, you would say

Plus @@ (#^2& /@ Range[10])

The “#^2&” is a pure function, and the “/@” applies the function to the numbers 1–10 and puts them in a list.  Then the function “Plus” is applied, which adds the numbers together.

There is a similar construct in Python.  The same sum of 385 can be computed by using

sum([(n + 1)**2 for n in range(10)])

OK, this looks a little different, but it’s just the syntax.  Rather than the “#” character for the variable in the pure function, you provide the variable name.  The “for” here is called list comprehension in Python, though it is just a map.  Of course you need “(n + 1),” since Python always starts at 0, so that “range(10)” actually refers to the numbers 0–9.  And the “sum” function can take a list of numbers as well.  But from a conceptual level, the same thing is going on.

The inherent “return” in any Mathematica function does find its way into Python as well. Let’s take a look at a simple example:  we’ll write a function which computes the maximum of two numbers.

Now you’d probably think to write:

Day117python1

This is the usual way of defining “max.”  But there’s another way do to this in Python.

If you ask Python to

print 3 > 2,

you’ll see “True.”  But you can also tell Python to

print (3 > 2) + 7

and get “8.”  What’s going on here is that depending on the context, “3 > 2” can take on the value “True” or “1.”  Likewise, “3 < 2” can take on either the value “False” or the value “0.”

This allows you to completely sidestep making Boolean checks.  Consider the following definition.

Day117python2

This also works!  If in fact a >= b, you return the value 1 * a + 0 * b, which gives you a — the maximum value when a >= b.  And when a < b, you return b.  Note that when a = b, both are the maximum, so we could just as well have written

Day117python3

I think this is a neat feature of Python, which does not have a direct analogue in Mathematica.  I am hoping to learn many other intriguing features like this as I dive deeper into Python.

Python is my newest language, and I have yet to become “fluent.”  I still sometimes ask the internet how to do simple things which would be at my fingertips in Mathematica.  But I do love learning new languages!  Maybe in a year or so I’ll update my On Coding entry on Python with a flurry of new and interesting things I’ve learned….

Mathematics and Digital Art: Update 2 (Fall 2017)

We’ve just completed Week 8 of the Fall semester, so it’s time for the next update on my Mathematics and Digital Art class!  As I had mentioned before, the major difference this semester was starting with Processing right from the beginning of the semester.

It turns out this is making a really big difference in the way the class is progressing.  The first two times I taught the course, I had students work in the Sage environment for the first half of the semester.  The second half of the semester was devoted to Processing and student projects.

Because students only started to learn Processing at the same time they were diving into their projects, they were not able to start off with a Processing-based project.  As it happened, a few students actually incorporated Processing into their final projects as the second half of the semester progressed, but this was the exception, not the rule.

But last week, we already started making movies in Processing!  Starting simply, of course, with the dot changing colors.


This was a bit easier to present this time around, since we already had a discussion of user space vs. screen space earlier in the semester.  So this time, I could really focus on linear interpolation — the key mathematical concept behind making animations.

Next week will be a Processing-intense week.  I’ll delay some topics — like geometric series — to a little later in the course so we can get more Processing in right now.  The reason?  I really think many students will involve Processing in their final projects in a significant way.  I want to make sure they have enough exposure to feel confident about going in that direction for their final projects.  I’ll let you know what happens in this regard in my next update of Mathematics and Digital Art.

Now for some examples of student work!  For the assignment on iterated function systems, students had three different images to submit.  The first was a Sierpinski triangle — I asked students to create an image simultaneously as close to and as far away from a Sierpinski triangle as possible.  The idea was that a viewer should recognize the image as being based on a Sierpinksi triangle, but perhaps only after staring at it for thirty seconds or so.

This is Sepid’s take on the assignment.  On many of her pieces, she experimented with different ways to crop the final image.  This has a significant effect on the image’s final appearance.

Day115Sepid1.png


This is Cissy’s submission for the Sierpinski triangle.  In this piece (and the others submitted for this assignment), Cissy remarked that she really enjoyed experimenting with color.  I commented that I thought color choices were among the most difficult decisions to make as far as elements of a work of digital art are concerned.

Day115Cissy1.png

The second piece was to involve only two affine transformations.  This is often a challenge for students, but there really is an enormous variety of images that may be created using just two transformations.  In addition, one of the transformations needed to involve a rotation by a non-trivial angle (that is, not a multiple of 45°), and students needed to submit a picture of their calculations as well.

One student was trying to create an image that looked like an animal footprint.  She remarked that she did consider a different color palette, but in the end, preferred to go with monochromaticity.
Day115L2.png

Interestingly, Terry also used a simple color palette.  She remarked that it was challenge to use just two transformations — and because of this minimalist requirement, decided to go with a minimalist color palette.  In addition, her resulting fractal reminded her of birds, so she set the fractal against a white moon and gray sky.

Day115Terry2

For the third submission, there were no constraints whatsoever — in fact, I encouraged students to be as creative as possible.  There was a very wide range of submissions.  One student was fairly minimalistic, using a highly contrasting color palette.

Day115A

Jack’s piece was also fairly minimalistic.  I should remark that we took part of a lab one day for students to do some online peer commenting; Jack (and others as well) remarked that he used the advice of another student to improve an earlier draft of his piece.  In particular, he adjusted the stroke weight to increase the intensity of the colors.

Day115Jack.png

Tera based her work on the Sierpinski triangle,  but also included reflections of each of the three smaller components of her version of the Sierpinski triangle.  She remarked that the final image reminded her of a snowflake, or perhaps a Christmas sweater.

Day115Tera.png

Alex’s inspiration came from The Great Wave off Kanagawa, by Katsushika Hokusai.

The_Great_Wave_of_Kanagawa.jpg
Courtesy the Wikipedia Commons.


First, he created the fractal image, experimenting with various color combinations.  When he was satisfied with his palette, he added the boat and the white circle to suggest a black moon.  A rather interesting approach!

Day115Alex.png

As you can see, I’ve got quite a creative class of students who are willing to experiment in many different ways.  It’s interesting for me, since there is no way to predict what they’ll create next!  I look forward to seeing what they create when they really dive deeply into Processing and begin making animations.

In the next update, I’ll report on how students involve Processing in their project proposals.  In addition, they will have submitted their fractal movie projects by then, so there will undoubtedly be many interesting examples of student work to exhibit.  Stay tuned!

Mathematics and Digital Art: Update 1 (Fall 2017)

About a month has passed since beginning my third semester of Mathematics and Digital Art!  As with last semester, I plan on giving updates about once a month to discuss changes in the course and to showcase student work.

The main difference this semester (as I discussed a few weeks ago) was starting with Processing right from the beginning.  From my perspective, the course has run more smoothly than ever — and some of my students are already really getting into the coding aspect of creating digital art.

I do believe that beginning this way will pay off when we get to making movies.  Since we’ll already know the basics and understand the difference between user space and screen space, I can focus more on the interactive abilities of Processing — such as having features of the displayed image change by moving the mouse or pressing different keys on the keyboard.

The first two assignments were essentially the same as last semester.  We began with discussing color and the work of Josef Albers, emphasizing the fact that there is no such thing as “pure color” — colors are only perceived in relation to other colors.

Again, I was surprised by the diversity of the images students created.  Like last year, a few students experimented with a minimalist approach.  Here is what Alex generated using just a 2-by-2 grid of squares.

Day112Alex

I should point out that outlining the geometrical objects (using the strokeWeight function) is not “pure” Albers — you aren’t really seeing one color on top of another due to the black outlines.  But I did have students submit three pieces, insisting that one of the pieces was created only by changing the parameters in the original Albers routine, as shown in the following submission.

Day112Linh2

Here is Courtney’s submission on this theme, again created only by changing parameters to the drawing routine.

Day112Courtney


Most students — I think in part due to the fact that we started discussing code even earlier than previous semesters — really pushed the geometry far beyond the simple idea of rectangles within rectangles.

While toying with various geometrical motifs, Tera found something that reminded her of a rose.  This influenced her color palette:  reds and pinks for the flowers, with a green background, meant to suggest that the flowers were in a garden.

Day112Tera

Cissy explored the geometry as well.  Note how keeping the stroke weight at zero — so that the geometrical objects have no outline — creates a more subtle effect, especially since the randomness from the dominant color is not too pronounced.

Day112Cissy

The second art assignment, as in the previous semesters, was to explore creating textures using randomness in both color and shape.  As with the first assignment, I wanted students to submit one piece which involved only changing the parameters to a given function.  In this case, the function created a grid of gray circles, with both the intensity of the gray and the size of the circles having some degree of randomness.  I think it is important that students do some work within given constraints — it really challenges their creativity.  Here is Terry’s piece along these lines.

Day112Terry


The second piece was based on a function which created a grid of squares of the same size, but random colors.  Here, there were no constraints — students could modify the geometry in any way they wanted to.  Several were quite creative.  For example, Sepid approached this task by choosing both shape and color to create an image reminiscent of a stained glass window.

Day112Sepid

The third piece involved a color gradient (see my previous posts on Evaporation).  If you look back at these posts, you’ll recall that a color gradient can be created by increasing the randomness of the colors as you move from the top of the image to the bottom using a power function:  f(y)=y 
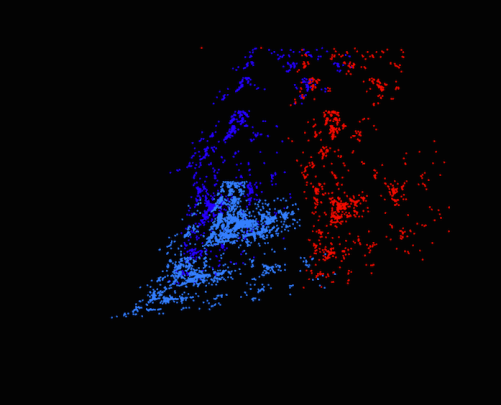
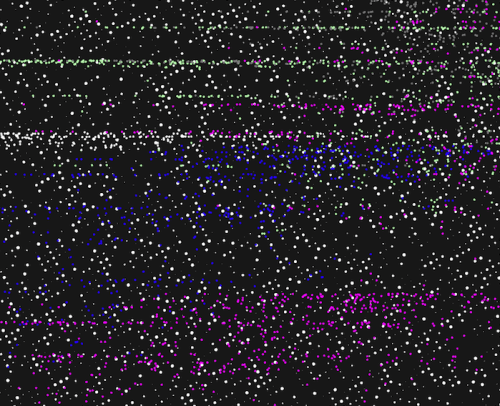
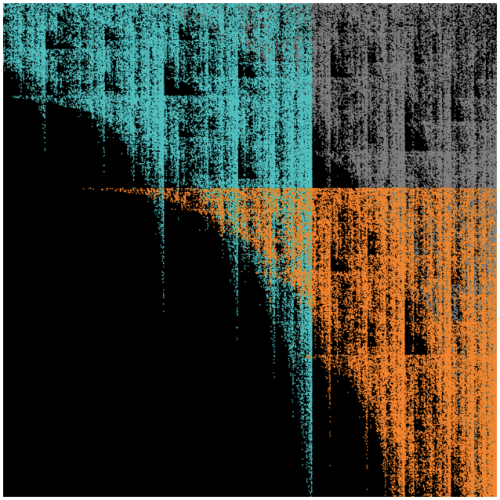
corresponds to a linear gradient, f(y)=y^2 corresponds to a quadratic gradient, etc.  Different effects can be created by varying the exponent.

As I was discussing this in class, one student asked what would happen if you used a negative exponent.  I had never thought about this before!  Jack used this idea in his piece, which he said reminds him of looking at a fire.

Day112Jack

It turns out that using a negative exponent creates a gradient beginning with black on the top.  Why is this?  As the image proceeds lower down the screen, the algorithm subtracts values from the RGB parameters proportional to y^n, where y=0 corresponds to the top of the image, and y=1 corresponds to the bottom of the image.

So if the exponent n is positive, there is very little randomness subtracted.  But if the exponent is negative, a lot of randomness is subtracted, since now the numbers near 0 are on the denominator.  Because the RGB values only go up to 255, subtracting a large degree of randomness leaves nothing left — in other words, black.  Now some of the numbers will end up being negative  near the top– but putting all negative numbers in a color specification in Processing does in fact give you black.

Another student also worked with yellows and reds to imitate fire in another way.  Instead of making small circles, he made larger circles with quite a bit of overlap, creating a rather different effect.

Day112Ali.png

And Rosalie found in interesting say to create stripes with the algorithm.  I had not seen this effect before.

Day112Rosalie

So that’s it for the first update of the Fall 2017 installment of Mathematics and Digital Art.  As you can see, my students are already being quite creative.  I look forward to seeing their work develop as the semester progresses!


Using Processing for the First Time

While I have discussed how to code in Processing in several previous posts, I realized I have not written about getting Processing working on your own computer.  Naturally I tell students how to do this in my Mathematics and Digital Art course.  But now that I have started a Digital Art Club at the University of San Francisco, it’s worth having the instructions readily accessible.

The file I will discuss may be used to create an image based on the work of Josef Albers, as shown below.

0001

See Day002 of my blog,  Josef Albers and Interaction of Color, for more about how color is used in creating this piece.

As you would expect, the first step is to download Processing.  You can do that here.  It may take a few moments, so be patient.

The default language used in Processing is Java.  I won’t go into details of why I’m not a fan of Java — so I use Python mode.  When you open Processing, you’ll see a blank document like this:

Day110Screen1

Note the “Java” in the upper right corner.  Click on that button, and you should see a menu with the option “Add Mode…”  Select this option, and then you should see a variety of choices — select the one for Python and click “Install.”  This will definitely take a few minutes to download, so again, be patient.

Now you’re ready to go!  Next, find some Processing code written in Python (from my website, or any other example you want to play around with).  For convenience, here is the one I’ll be talking about today:  Day03JosefAlbers.pyde.  Note that it is an Open Office document; WordPress doesn’t let you upload a .pyde file.  So just open this document, copy, and paste into the blank sketch.  Be aware that indentation is important in Python, since it separates blocks of code.  When I copied and pasted the code from the Open Office document, it worked just fine.  But in case something goes awry, I always use four spaces for successive indents.

Now run the sketch (the button with the triangle pointing to the right).  You will be asked to create a new folder; just say yes.  When Processing runs, it often creates additional files (as we’ll see in a moment), and so keeping them all in one folder is helpful.  You should also see the image I showed above; that is the default image created by this Processing program.

Incidentally, the button with the square in the middle stops running your sketch.  Sometimes Processing runs into a glitch or crashes, so stopping and restarting your sketch is sometimes necessary.  (I still haven’t figured out why it crashes at random times.)

Next, go to the folder that you just created.  You should see a directory called “frames.”  Inside, you should see some copies of the image.

Day110Screen2

Inside the “draw” function, there is a function call to “saveFrame,” which saves copies of the frames you make.  You can call the folder whatever you want; this is convenient, since you might want to make two different images with the same program.  Just change the folder name you save the images to.

A word about the syntax.  The “####” means the frames will be numbered with four digits, as in 0001.png, 0002.png, etc.  If you need more than 10,000 frames (likely you won’t when first starting), just add more hashtags.  The “.png” is the type of file.  You can use “.tif” as well.  I use “.tif” for making movies, and “.png” for making animated gifs.  There are other file types as well; see the documentation on saveFrame for more details.

Now let’s take a look at making your own image using this program.

Day110Screen3

If you notice, there are lines labelled “CHANGE 1” to “CHANGE 6” in the setup and draw functions.  These are the only lines you need to change in order to design you own piece. You may tweak the other code later if you like.  But especially for beginning programmers, I like to make the first examples very user-friendly.

So let me talk you through changing these lines.  I won’t bother talking about the other code right now — that would take some time!  But you don’t need to know what’s under the engine in order to create some interesting artwork….

CHANGE 1:  The hashtags here, by the way, indicate a comment in your code:  when your program runs, anything after a hashtag is ignored.  This makes it easy to give hints and provide instructions in a program (like telling you what lines to change).  I created a window 800 x 600 pixels; you can make it any size you want by changing those numbers. The “P2D” just means you’re working with a two-dimensional geometry.  You can work in 3D in Processing, but we won’t discuss that today.

CHANGE 2:  The “sqSide” variable indicates how big the square are, in units of pixels.  The default unit in Processing is always pixels, so if you want to use another geometry (like a Cartesian coordinate system), you have to convert from one coordinate system to another.  I do all this for you in the code; all you need to do is say how large each square is.  And if you didn’t go back and read the Josef Albers piece, by “square,” I mean a unit like this:

Day002Square

CHANGE 3, CHANGE 4:  The variables “sqRows” and “sqCols” indicate, as you would expect, how many rows and columns are in the final image.  Since I have 15 rows and the squares are 30 pixels on a side, the height of the image is 450 pixels.  Since my window is 600 pixels in height, this means there are margins of 75 pixels on the top and bottom.  If your image is too tall (or too wide) for the screen, it will be cropped to fit the screen.  Processing will not automatically resize — once you set the size of the screen, it’s fixed.

CHANGE 5:  The “background” function call sets the color of the background, using the usual RGB values from 0-255.

CHANGE 6:  The first three numbers are the RGB values of the central rectangles in a square unit.  The next three numbers indicate how the background colors of the surrounding rectangles change.  (I won’t go into that here, since I explain it in detail in the post on Josef Albers mentioned above.  The only difference is that in that post, I use RGB values from 0-1, but in the Processing code here, I use values from 0-255.  The underlying concept is the same.)

The last (and seventh) number is the random number seed.  Why is this important?  If you don’t say what the random number seed is (the code does involve choosing random numbers), every time you run the code you will get a different image — the computer just keeps generating more (and different) random numbers in a sequence.  So if you find an image you really like and don’t know what the seed is, you’ll likely never be able to reproduce it again!  And if you don’t quite like the texture created by using one random seed, you can try another.  It doesn’t matter so much if you have many rows and columns, but if you try a more minimalist approach with fewer and larger squares, the random number seed makes a big difference.

OK, now you’re on your own….  This should be enough to get you started, and will hopefully inspire you to learn a lot more about Python and Processing!